Using Security Onion and the Security Onion Console
- Interacting With Security Onion and the Security Onion Console
- Security Onion Console: First Look
- Security Onion Configuration: Set Home Networks
- Test Security Onion Detections
- Updating Security Onion
- Clear Security Onion Event Data
This section provides a basic overview of how to start using Security Onion. Security Onion does a lot, hopefully I can show you some of those things across these pieces. This section provides a quick introduction to the virtual machine’s command line and the Security Onion Console. There are also some steps on how to completing configuration by specifying your HOME_NET network, testing Security Onion’s ability to detect traffic, and updating Security Onion.
Interacting With Security Onion and the Security Onion Console
Now that you have installed Security Onion and connected it to the HOME_NET_LAN network to monitor traffic, it’s time to boot it up, log in to the Security Onion Console from the management network, and start to learn how to use it.
You interact with Security Onion in two ways: through the command line of the Linux virtual machine (VM), and through your web browser using the Security Onion Console. In both cases, you are connecting to the VM’s network adapter that you assigned for the “management network.” In this case, I connected it to VMware Workstation Pro’s NAT network.
Accessing the Security Onion Virtual Machine’s Command Line Interface
There are two ways to access the command line:
- Using the VMware Workstation Pro console window (which I have used throughout these tutorials).
- By connecting to the VM using SSH, the Secure Shell protocol. In my case, I do that on the Windows host machine using the IP address of the Security Onion VM network on the NAT network (the management network). To do so, you need the IP address of the VM on the management network and the credentials you created for the VM during initial installation.
Log in Using SSH
$ ssh <username>@<management-network-ip-address>- Enter your password.
- On Linux or macOS host machines, an SSH client is installed by default.
- On Windows, SSH may or may not be installed. Open PowerShell and run this command to check:
Get-WindowsCapability -Online | Where-Object Name -like 'OpenSSH.Client*'- It will return
State: Installedif SSH is installed. If not, use this PowerShell command to install it:Add-WindowsCapability -Online -Name OpenSSH.Client~~~~0.0.1.0.
- It will return
SSH Key Authentication: Linux
If you prefer to use SSH keys for authentication, you can add your SSH key pair to the Security Onion VM so you can log in without using a password. On Linux, you add your SSH public key to the VM and then log in using these commands.
$ ssh-copy-id -i ~/.ssh/<public-key-name>.pub <username>@<management-network-ip-address>- Enter your password.
- Once your SSH public key has been added to the VM, you can log in with
ssh -i ~/.ssh/<public-key-name> <username>@<management-network-ip-address>
SSH Key Authentication: Windows 11
To copy your SSH public key from a Windows computer to your Security Onion VM, use this equivalent version of ssh-copy-id for Windows:
- type
$env:USERPROFILE\.ssh\<public-key-name>.pub | ssh <username>@<management-network-ip-address> "mkdir -p ~/.ssh && cat >> ~/.ssh/authorized_keys" - Enter your password.
- Once your SSH public key has been added to the VM, you can log in with
ssh -i $env:USERPROFILE\.ssh\<public-key-name> <username>@<management-network-ip-address>.
Security Onion Console: First Look
-
To start Security Onion for the first time, click the play icon in the VMware Workstation Pro menu bar. (You can also select the VM (Virtual Machine) menu and click Power on this virtual machine.)
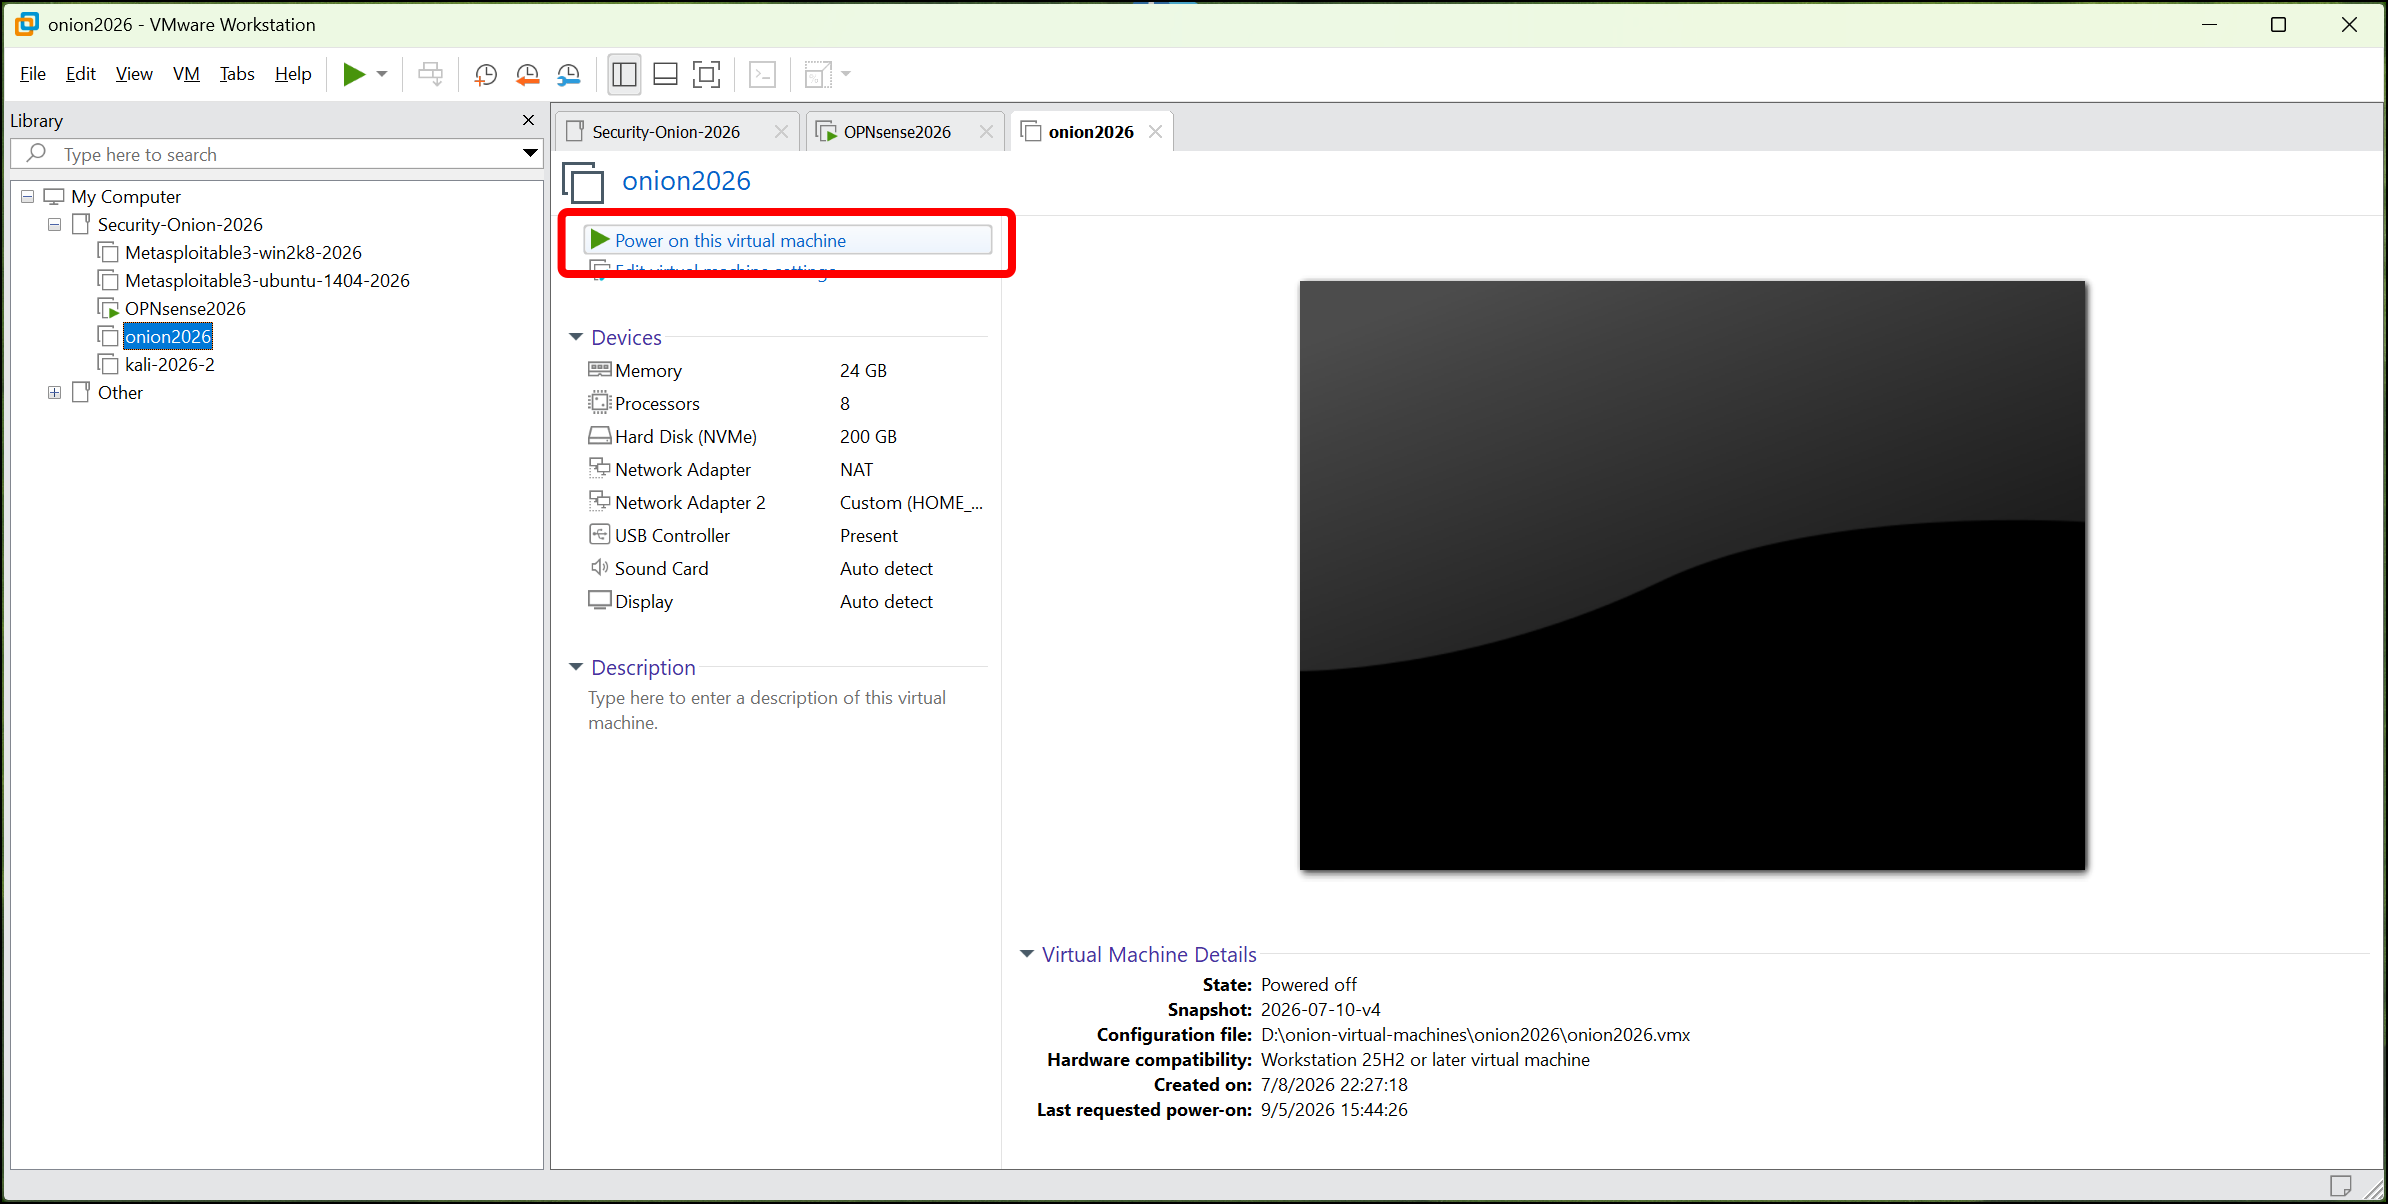
- Note: You will also want at least the OPNsense VM running; at this time running the Kali or Metasploitable VMs is optional.
- When you boot Security Onion after installation, you will see the login prompt with the hostname you gave to the system. Enter the Linux system credentials that you set for the VM during initial installation.

- When you successfully log in, a banner displays the URL to use for accessing the Security Onion Console on the management network. Type
sudo so-statusand enter your password to determine the status of Security Onion.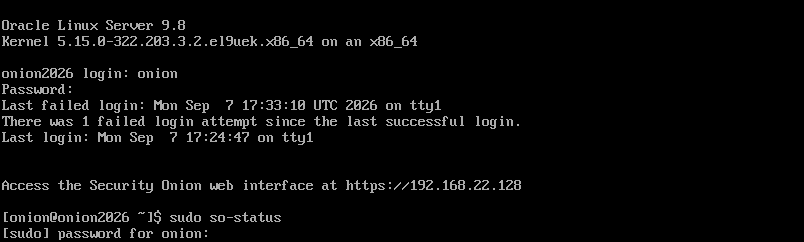
-
When I first run this command, I get the output
System appears to be starting. No highstate has completed since the system was restarted.This is the SaltStack application setting up the VM. Without getting into it too much, SaltStack is an application that can configure and orchestrate complicated application deployments. Security Onion uses it to manage its many container-based services. Thesalt-mastercommunicates the target state of the environment to the differentsalt-minions. This could be spread across multiple hosts in a complex environment, but here I have a single, standalone Security Onion VM, so the salt-master and salt-minion are working on the same host.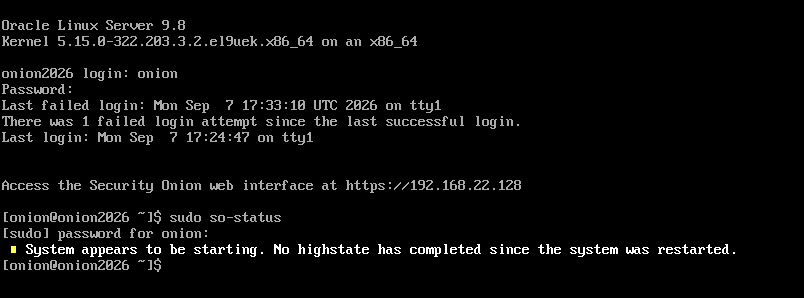
When you first boot Security Onion, it can take a long time for SaltStack to complete its configuration and bring up all of the Security Onion services. When I reviewed the logs after it ran the first time to create this content, it took about 45 minutes. You can follow along from the command line with
journalctl -u salt-minion -f. - Run
so-statusagain, eithersudo so-statusor switch to the root user withsudo su -and then runso-status. The output is a color-coded breakdown of all the Docker containers that make up Security Onion.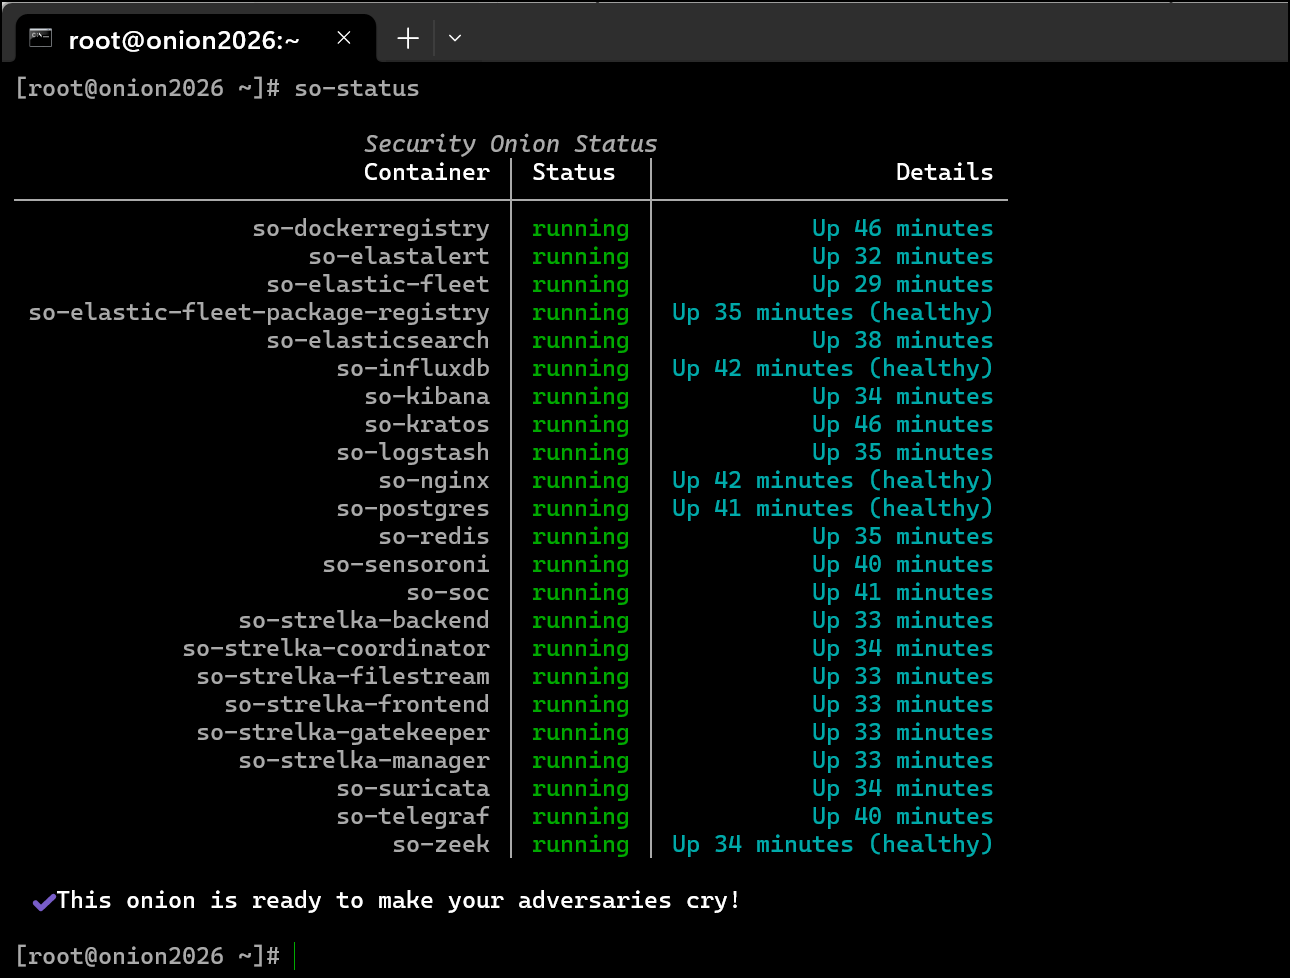
- Open your browser of choice and enter the URL from the login banner and enter it into the browser. Check the address bar to make sure that the URL starts with
https://.
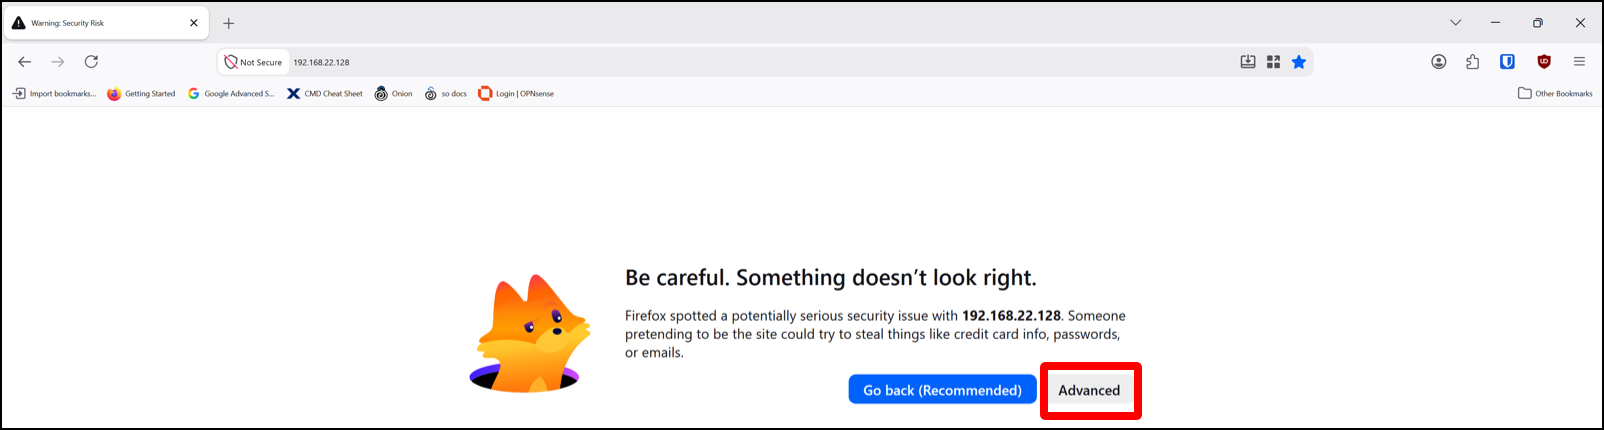
- Your browser will display a self-signed certificate warning (NET::ERR_CERT_AUTHORITY_INVALID). Click Advanced.
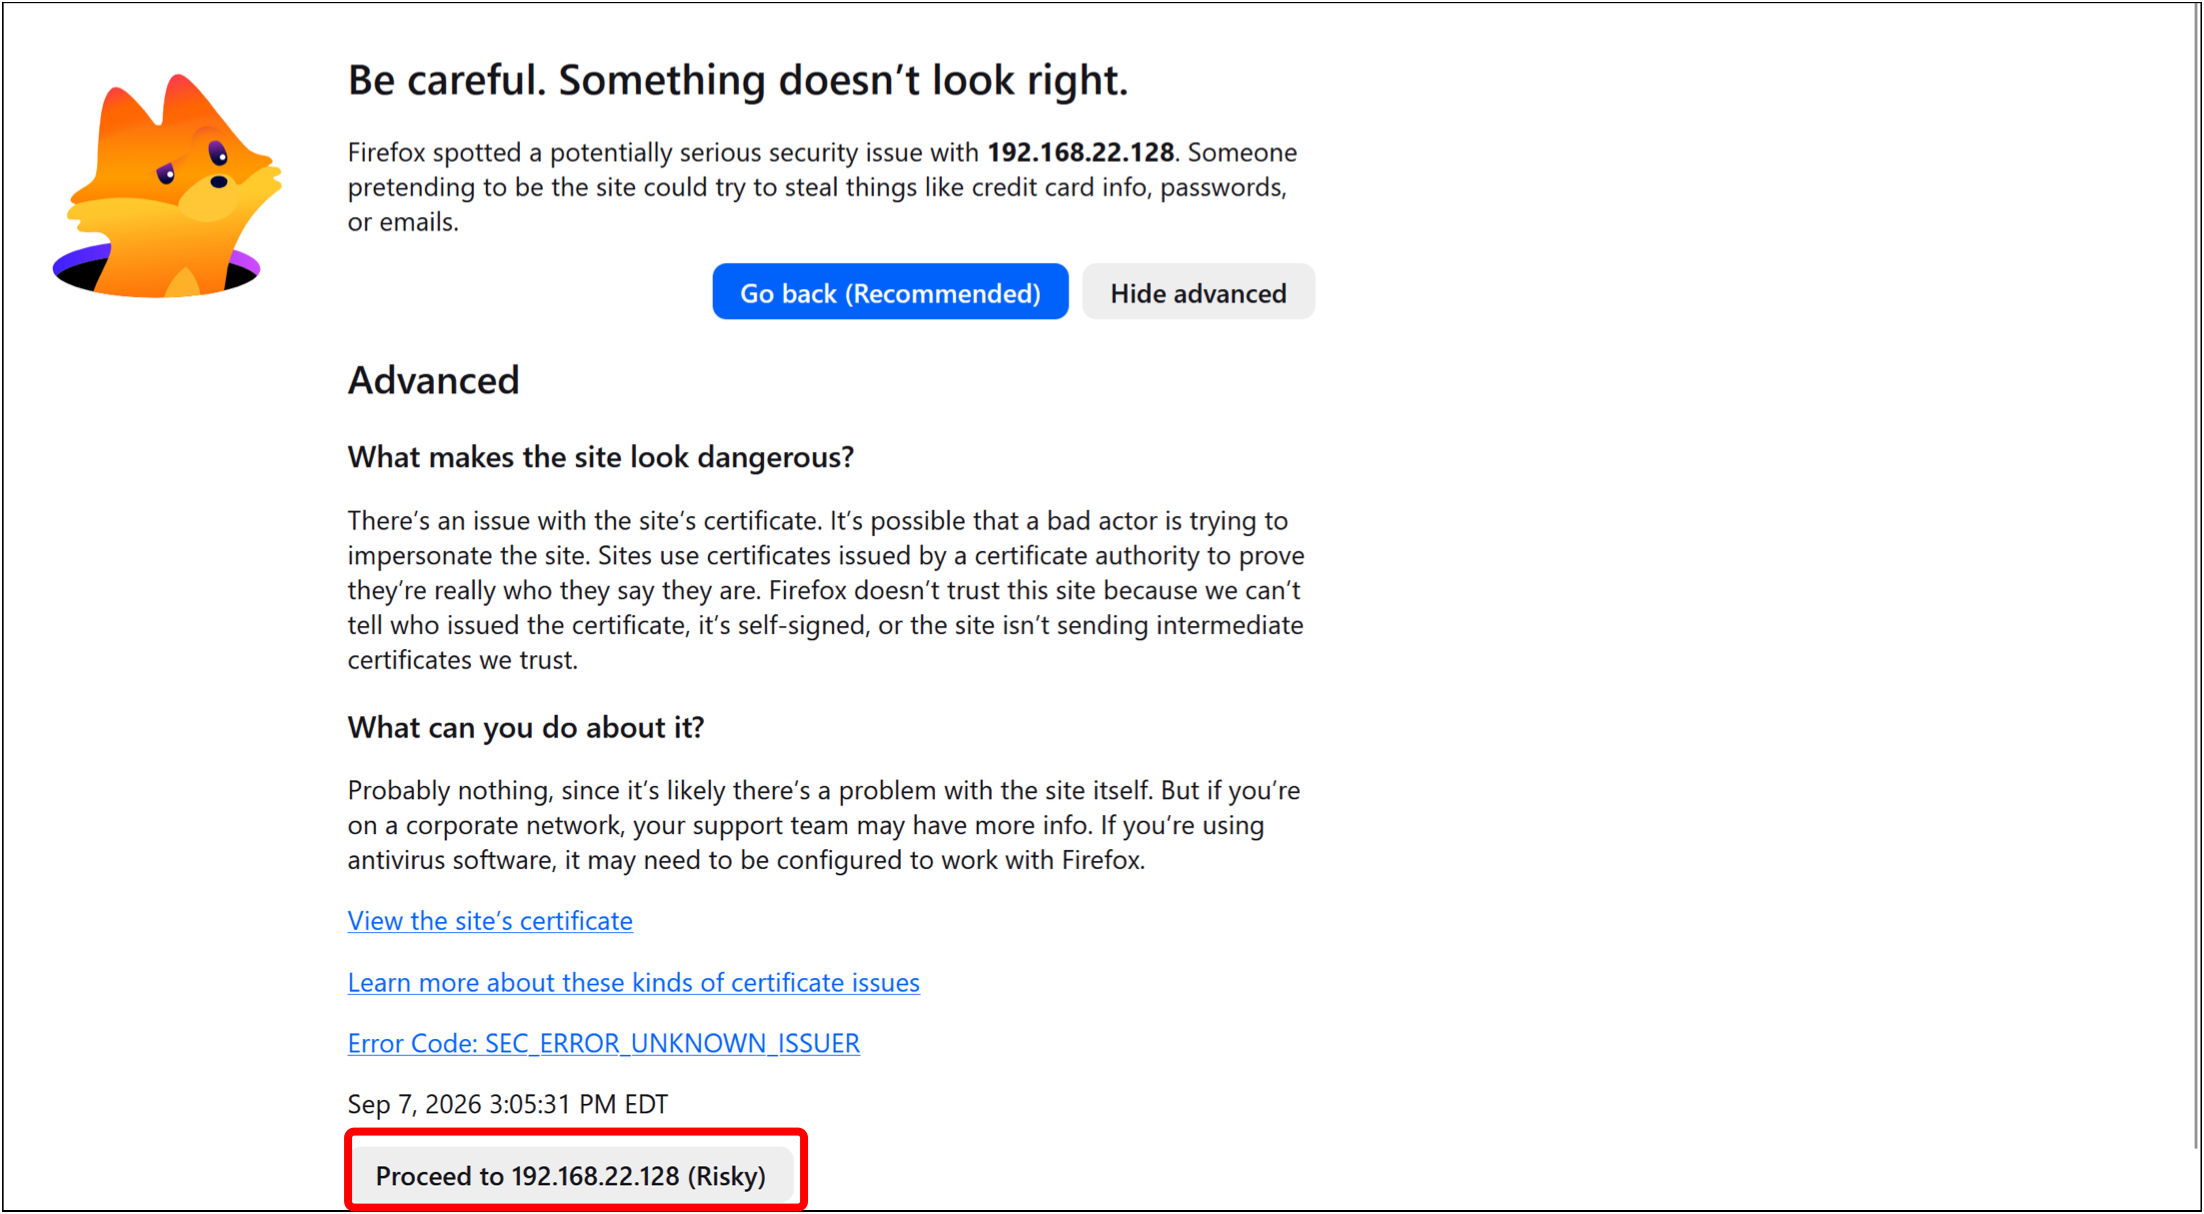
- Click Proceed to <Security-Onion-URL> (Risky).
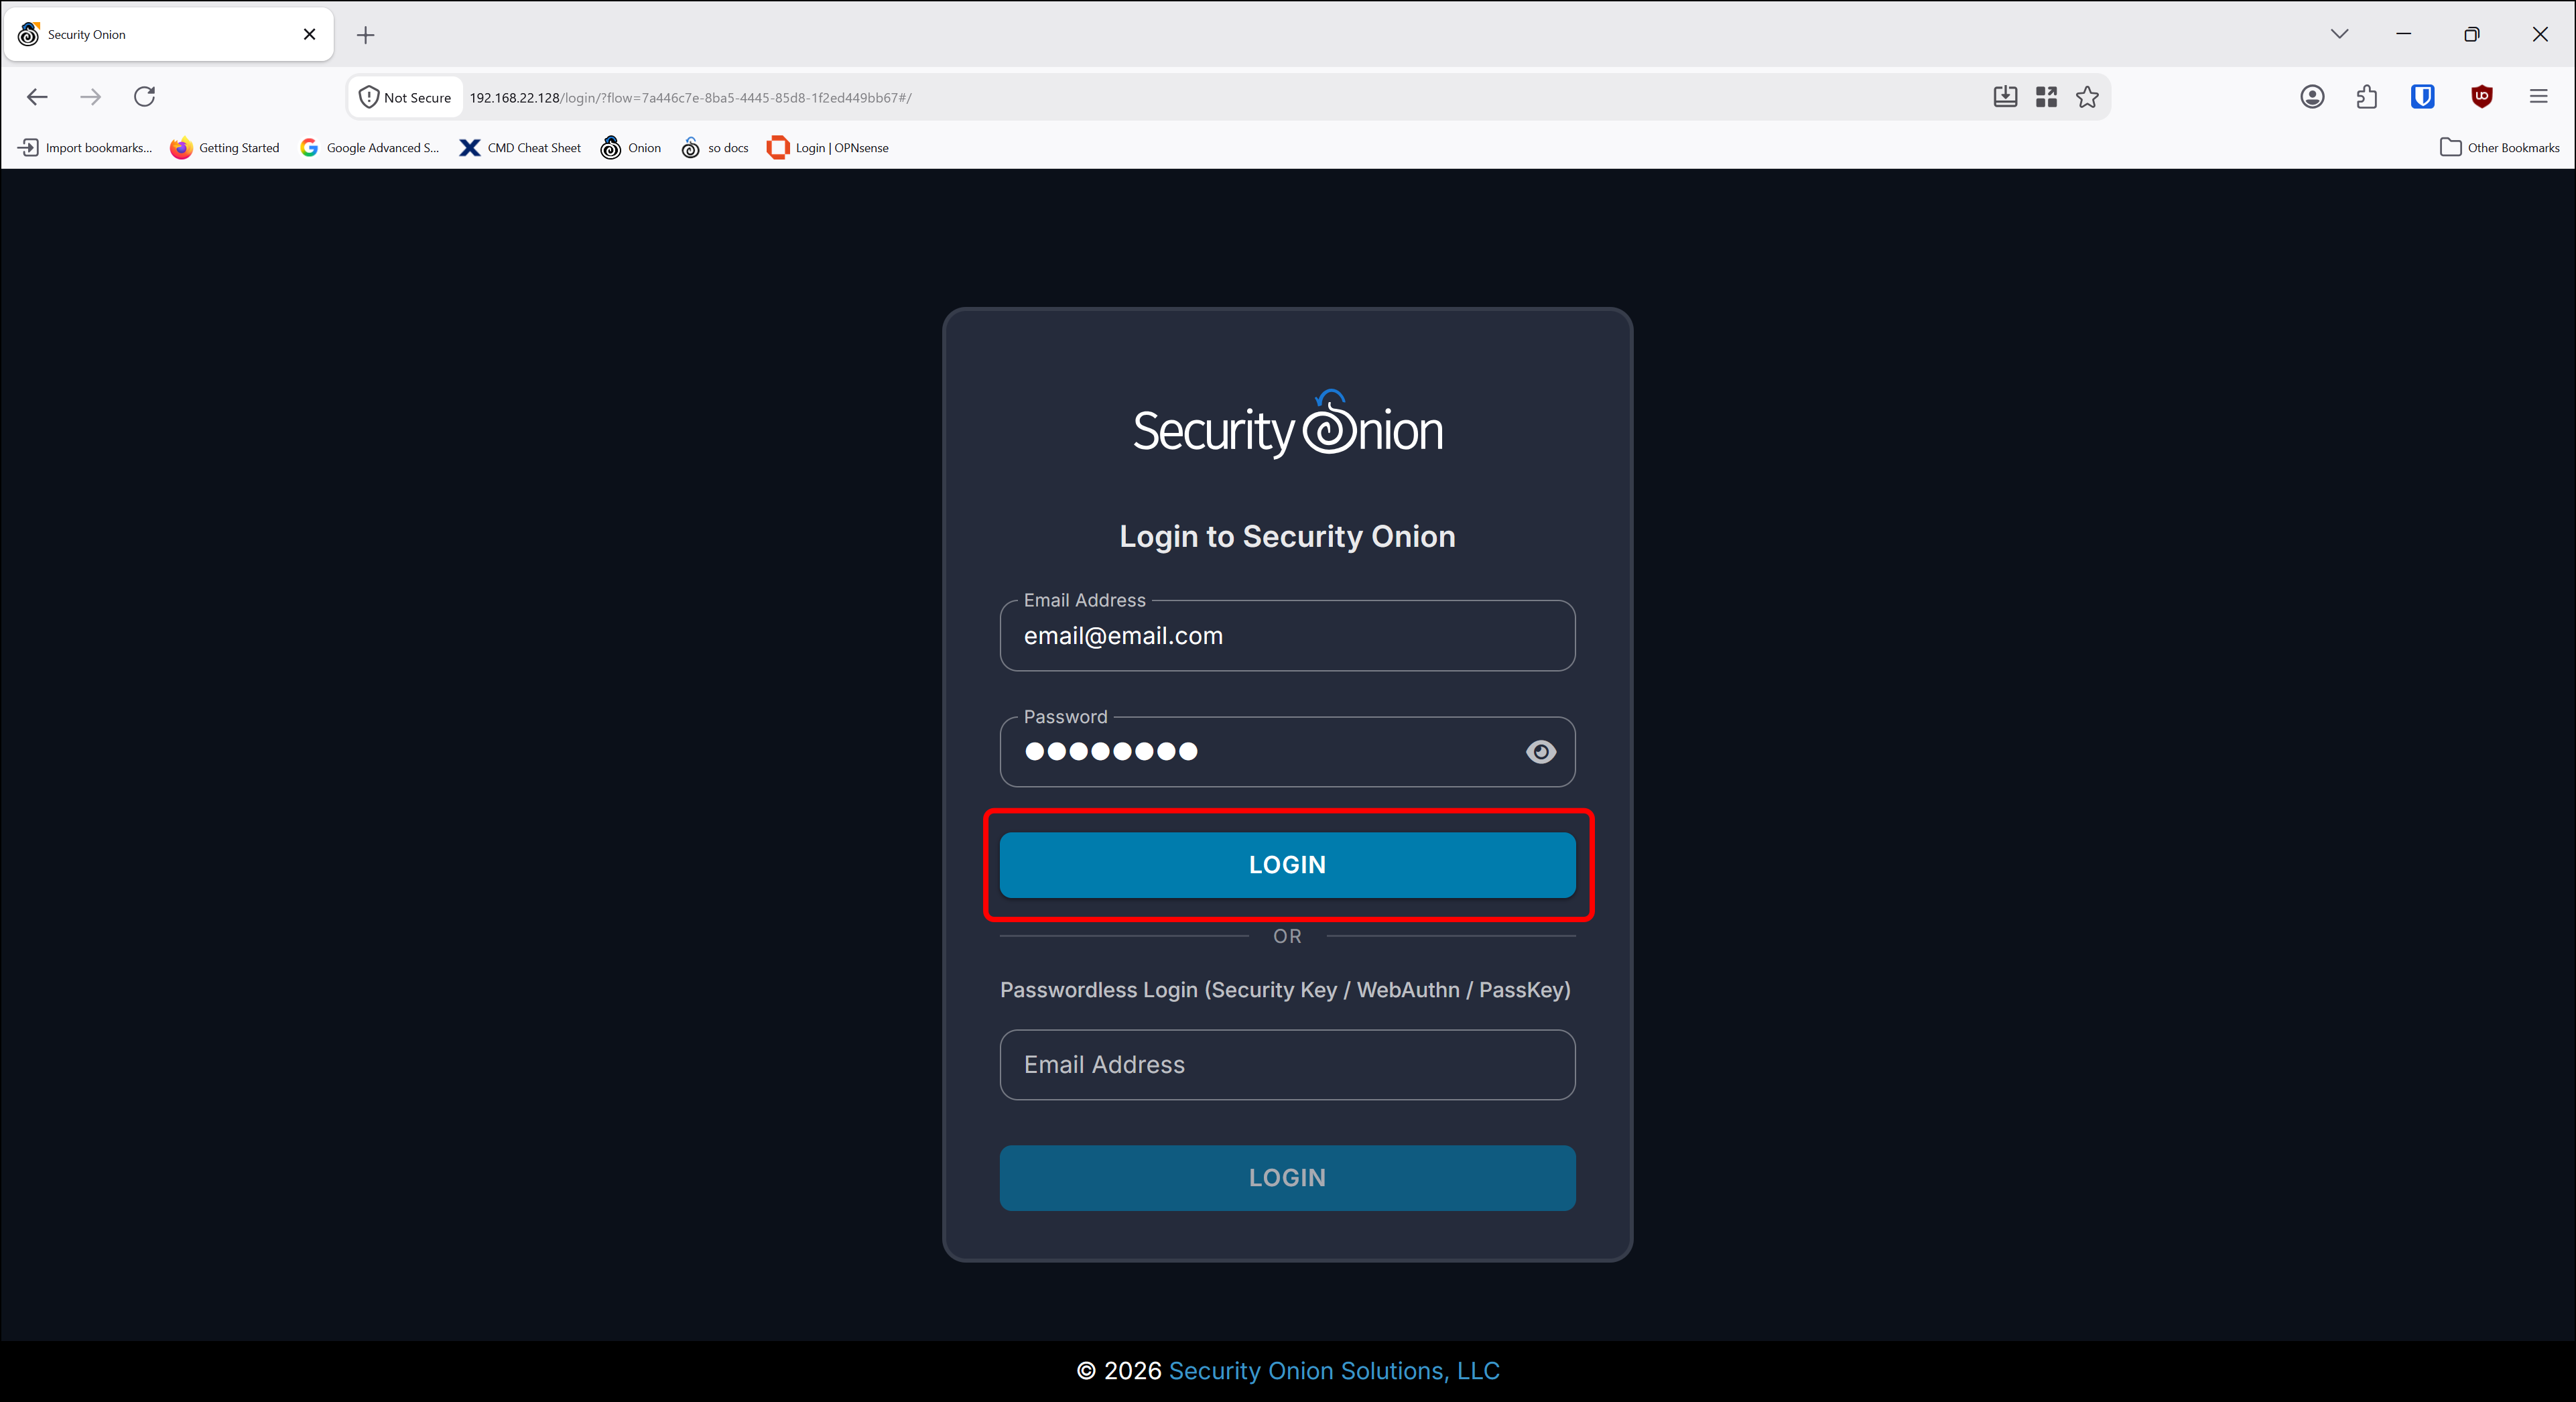
- Enter the email address and password that you entered during Security Installation configuration on the Login to Security Onion page and click Login.
-
The Security Onion Overview page loads with some introductory text about using and customizing Security Onion. In the left sidebar are links to itself as well as:
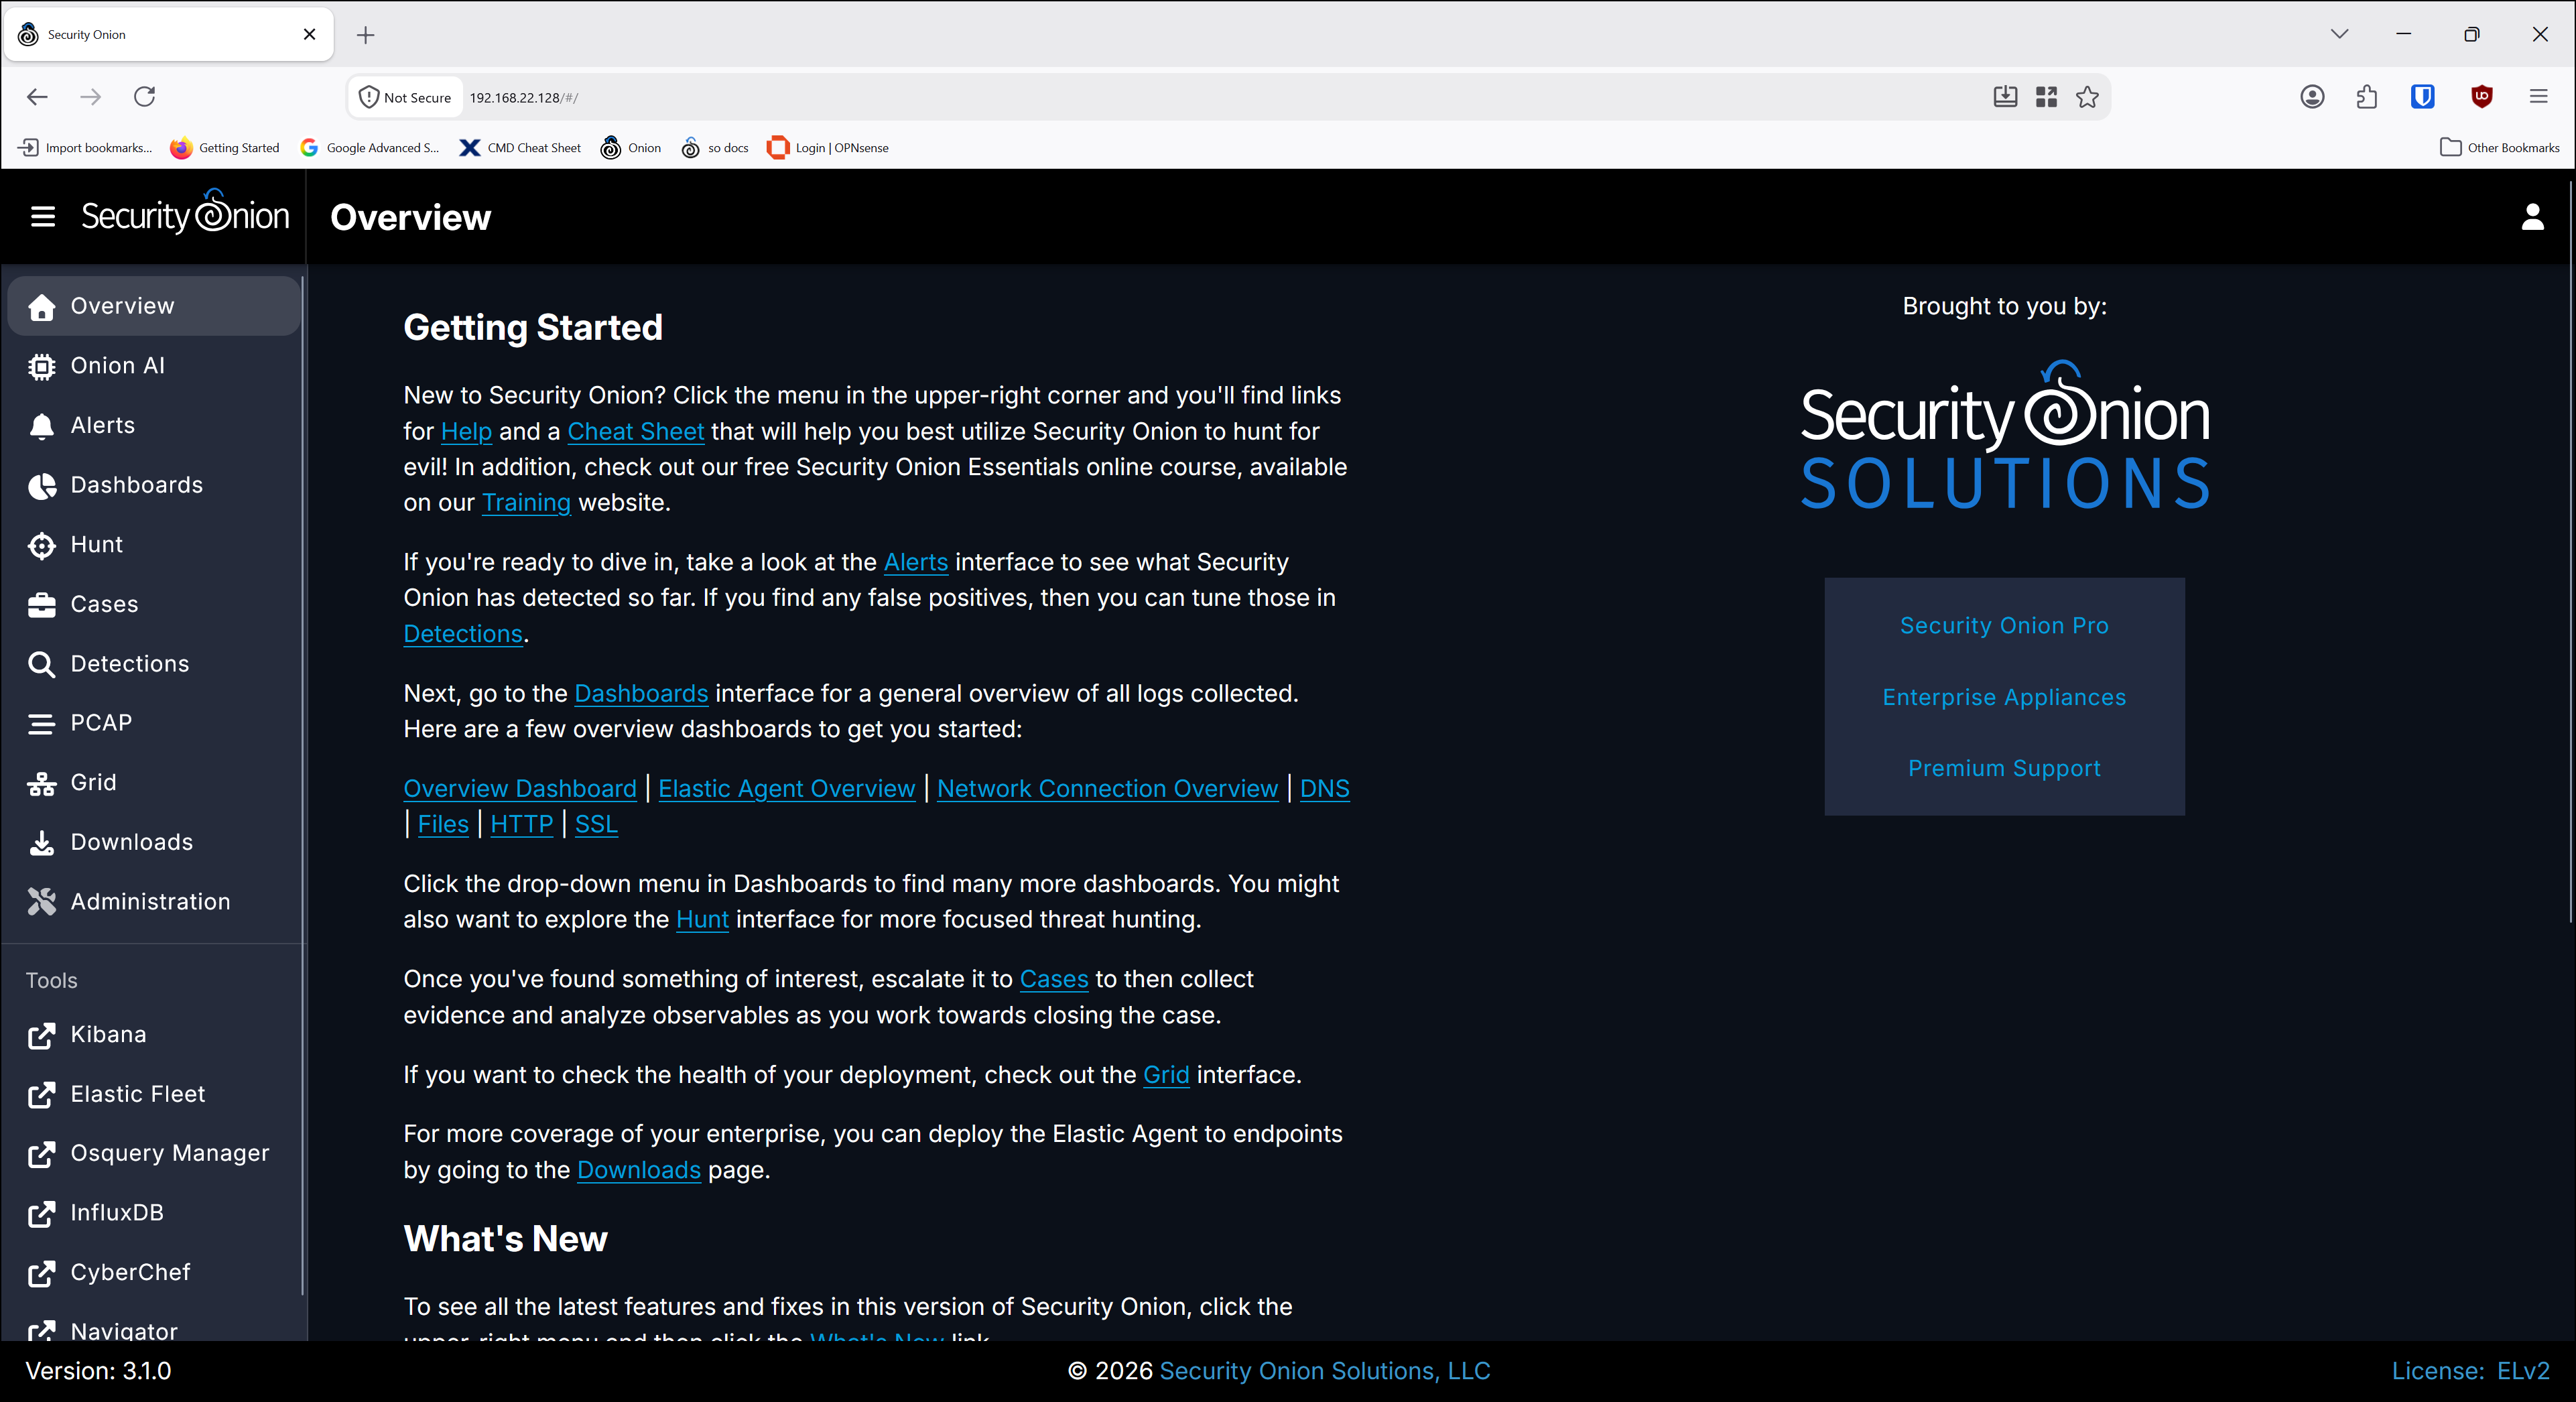
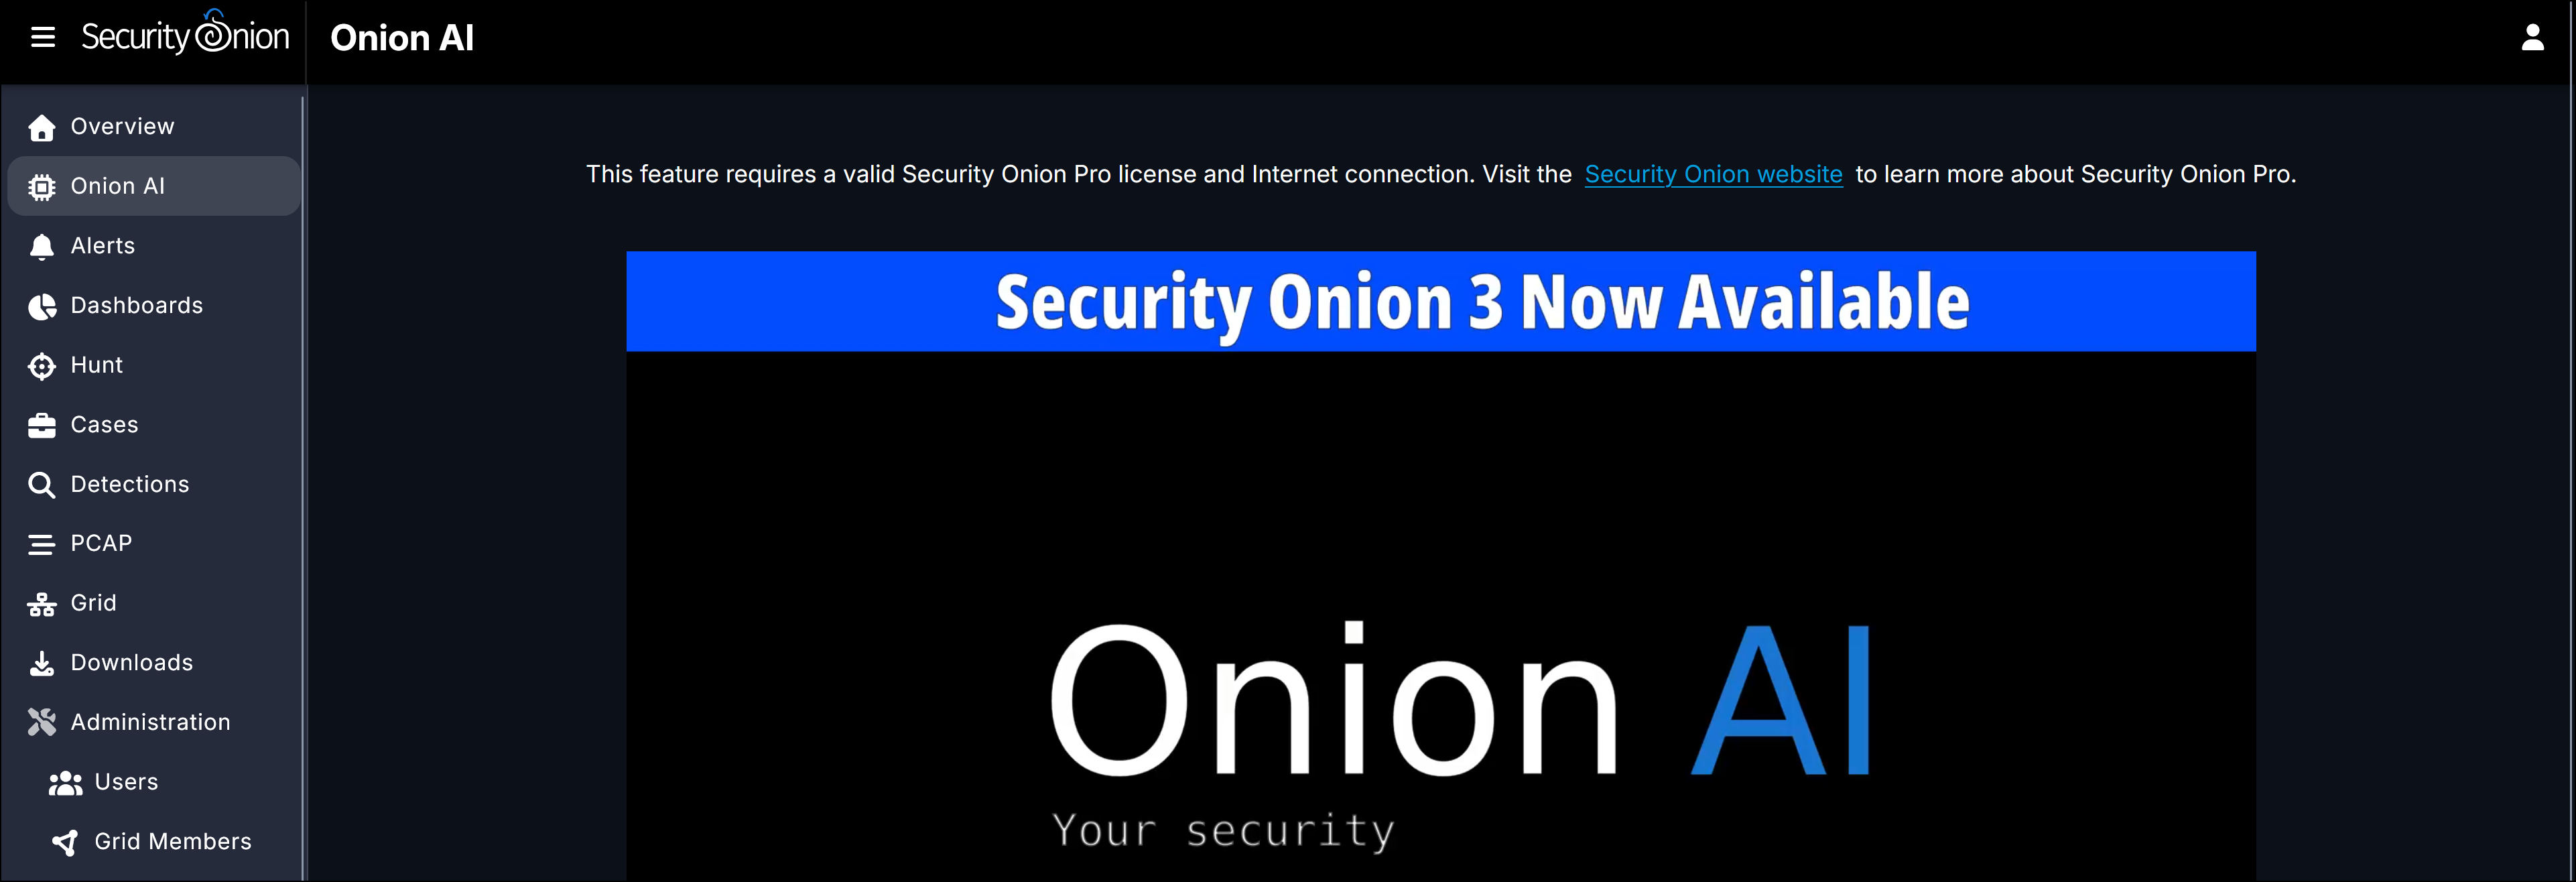
- Onion AI: This is a premium feature sold by the creator of Security Onion, Security Onion Solutions.
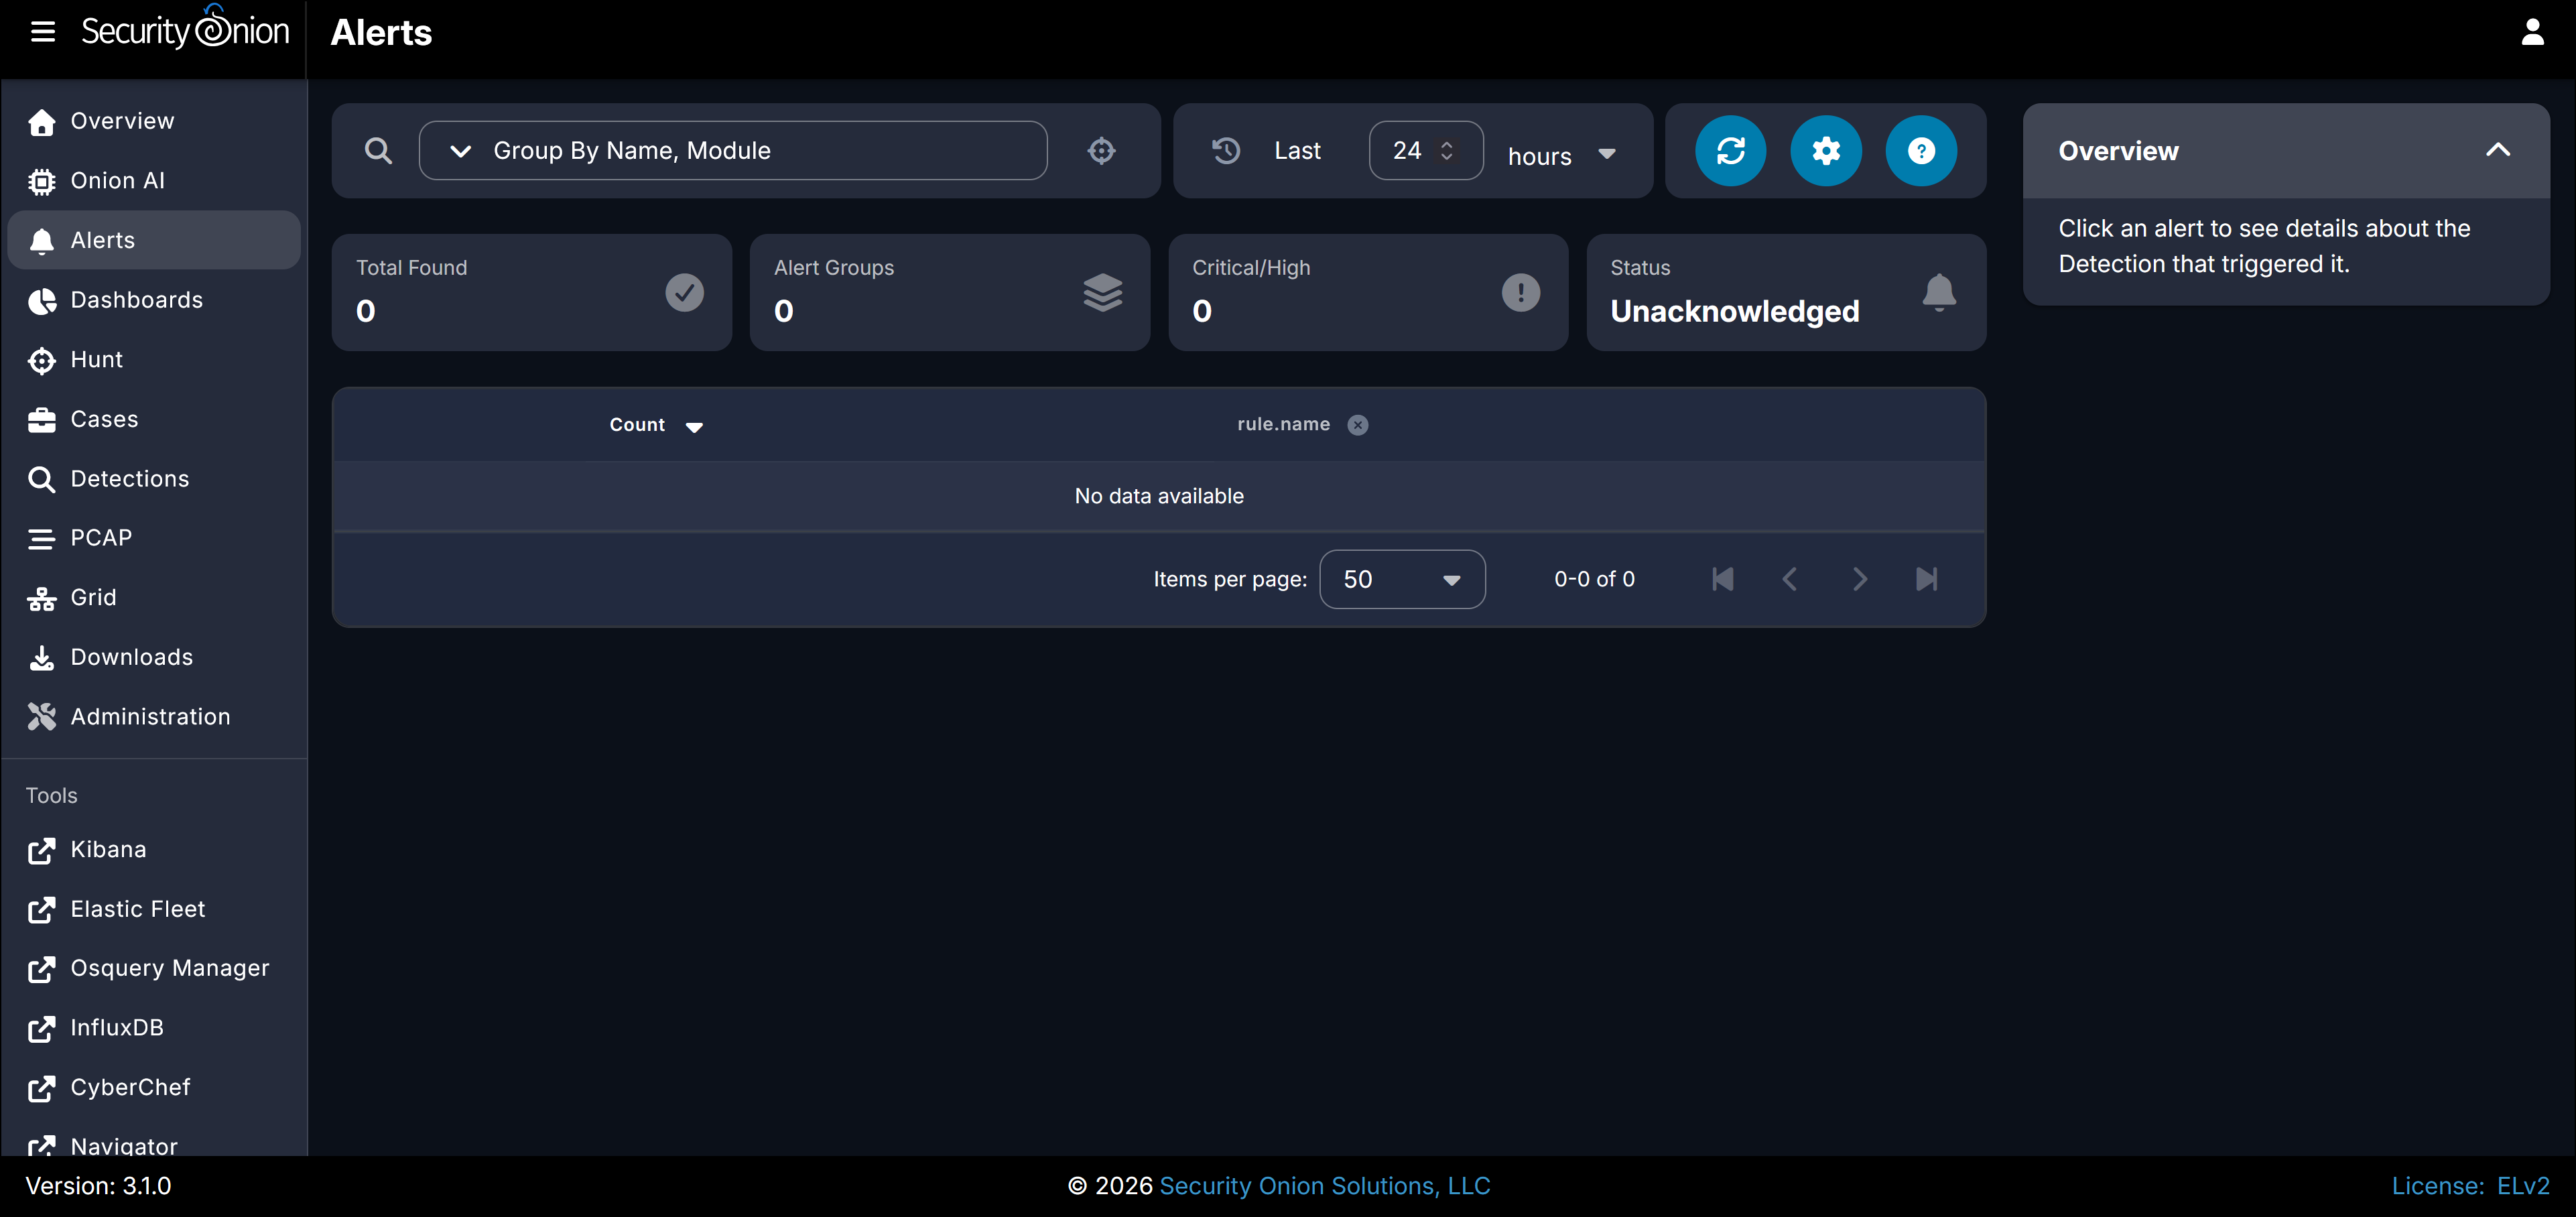
- The Alerts generated from Suricata rules.
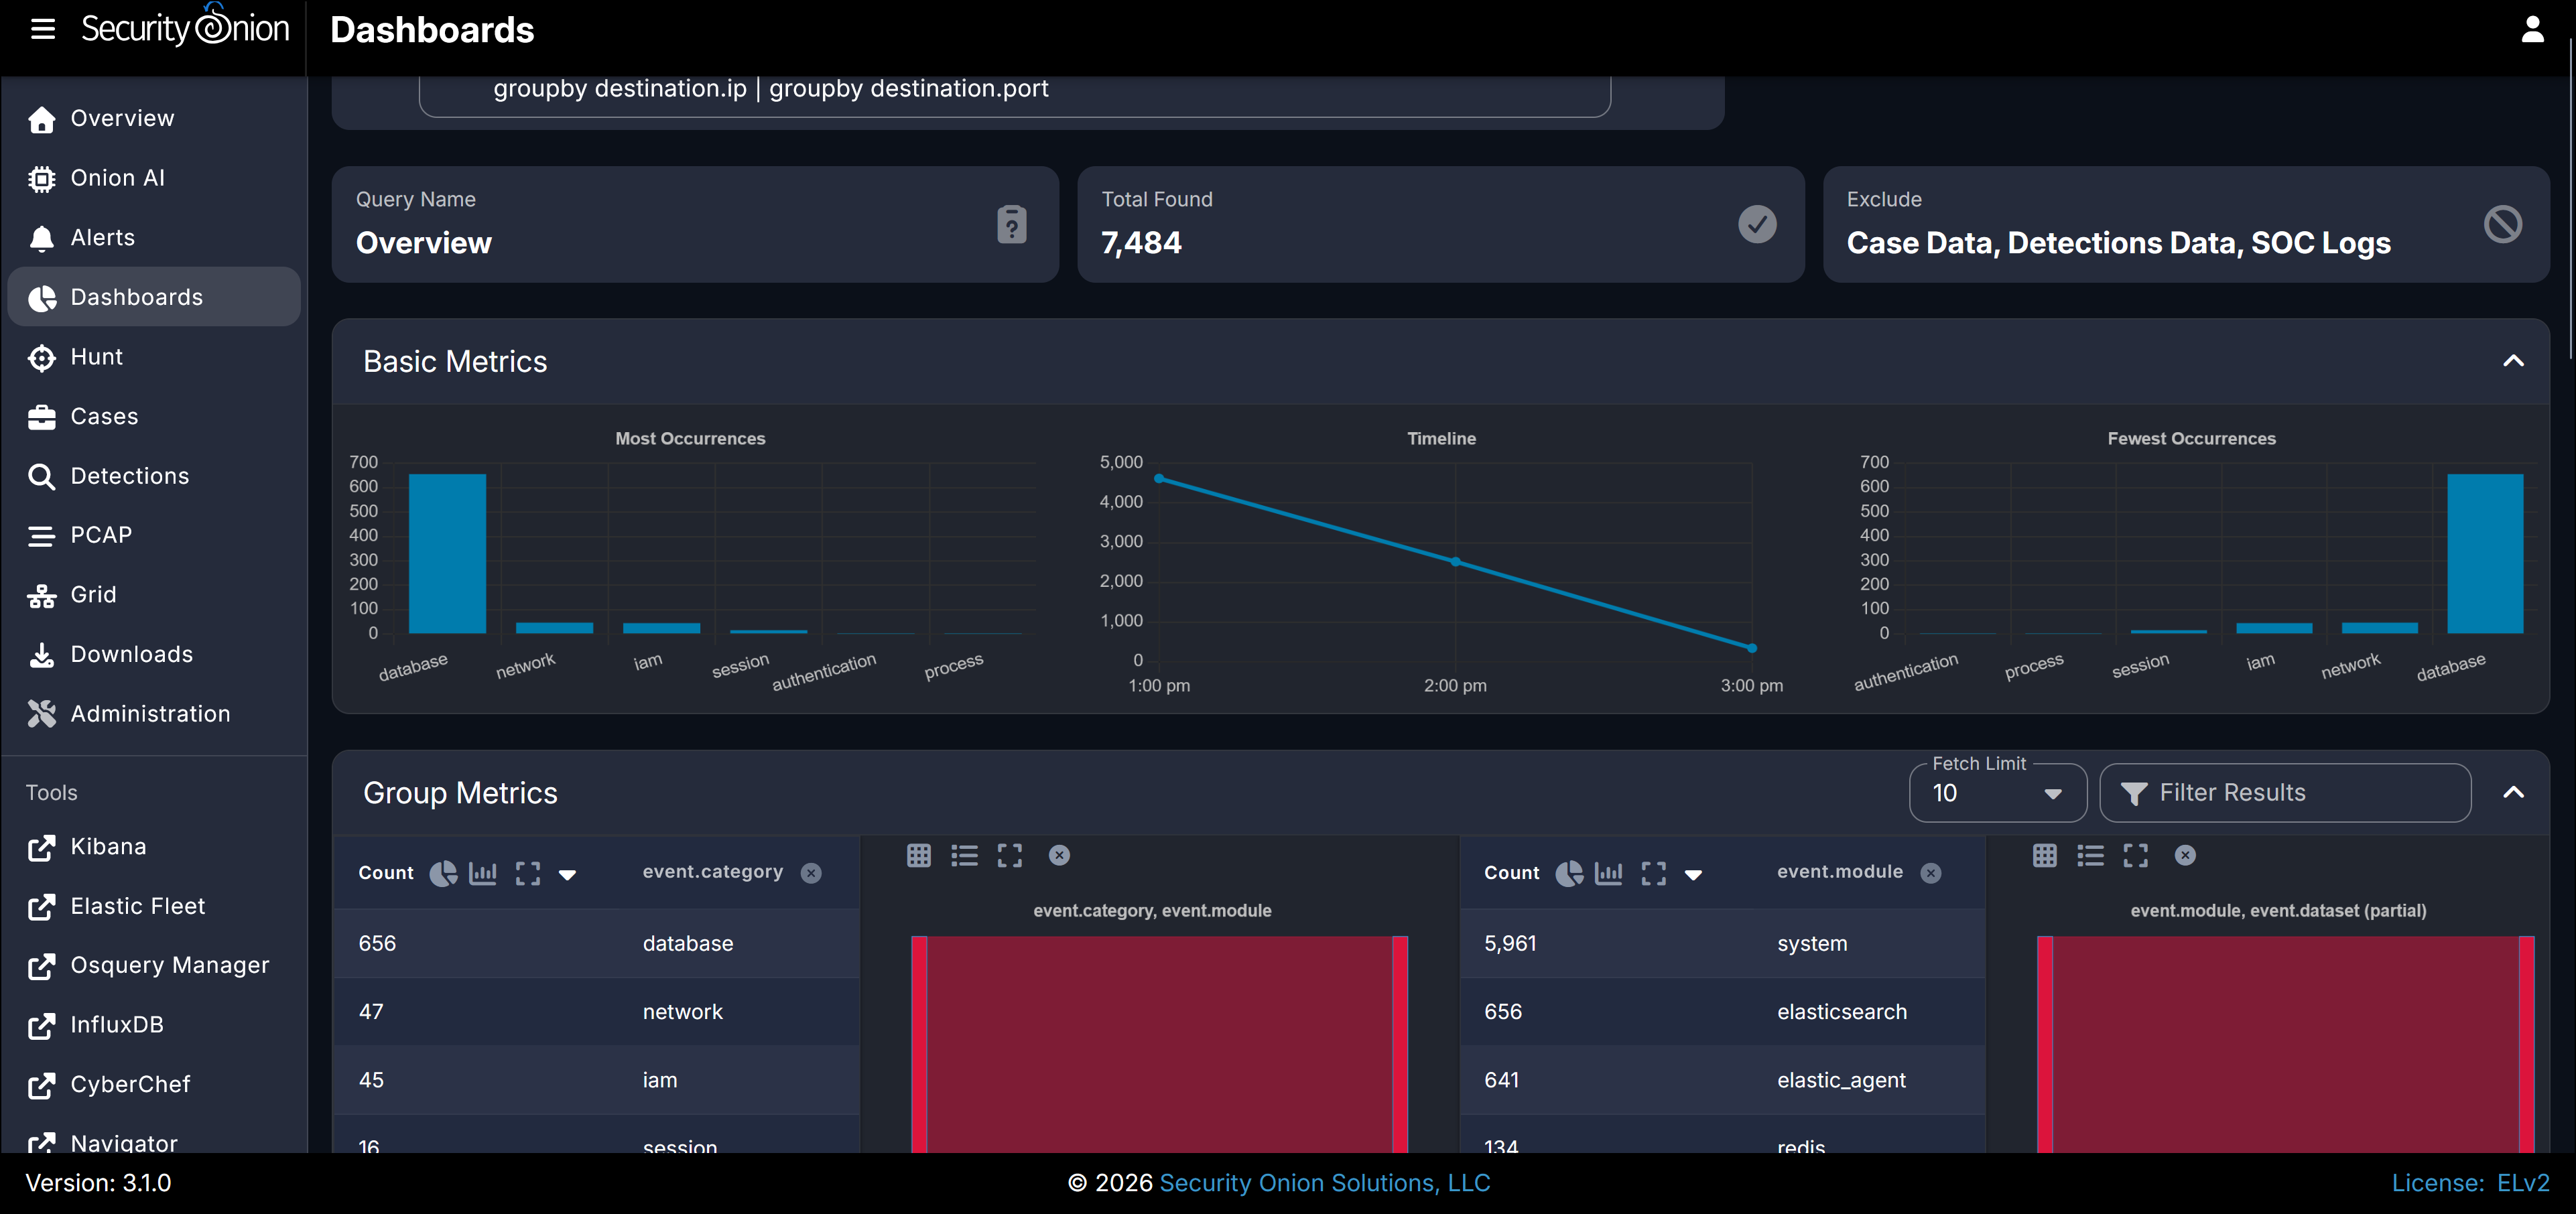
- A Dashboards page for creating your own visualizations of Security Onion data.
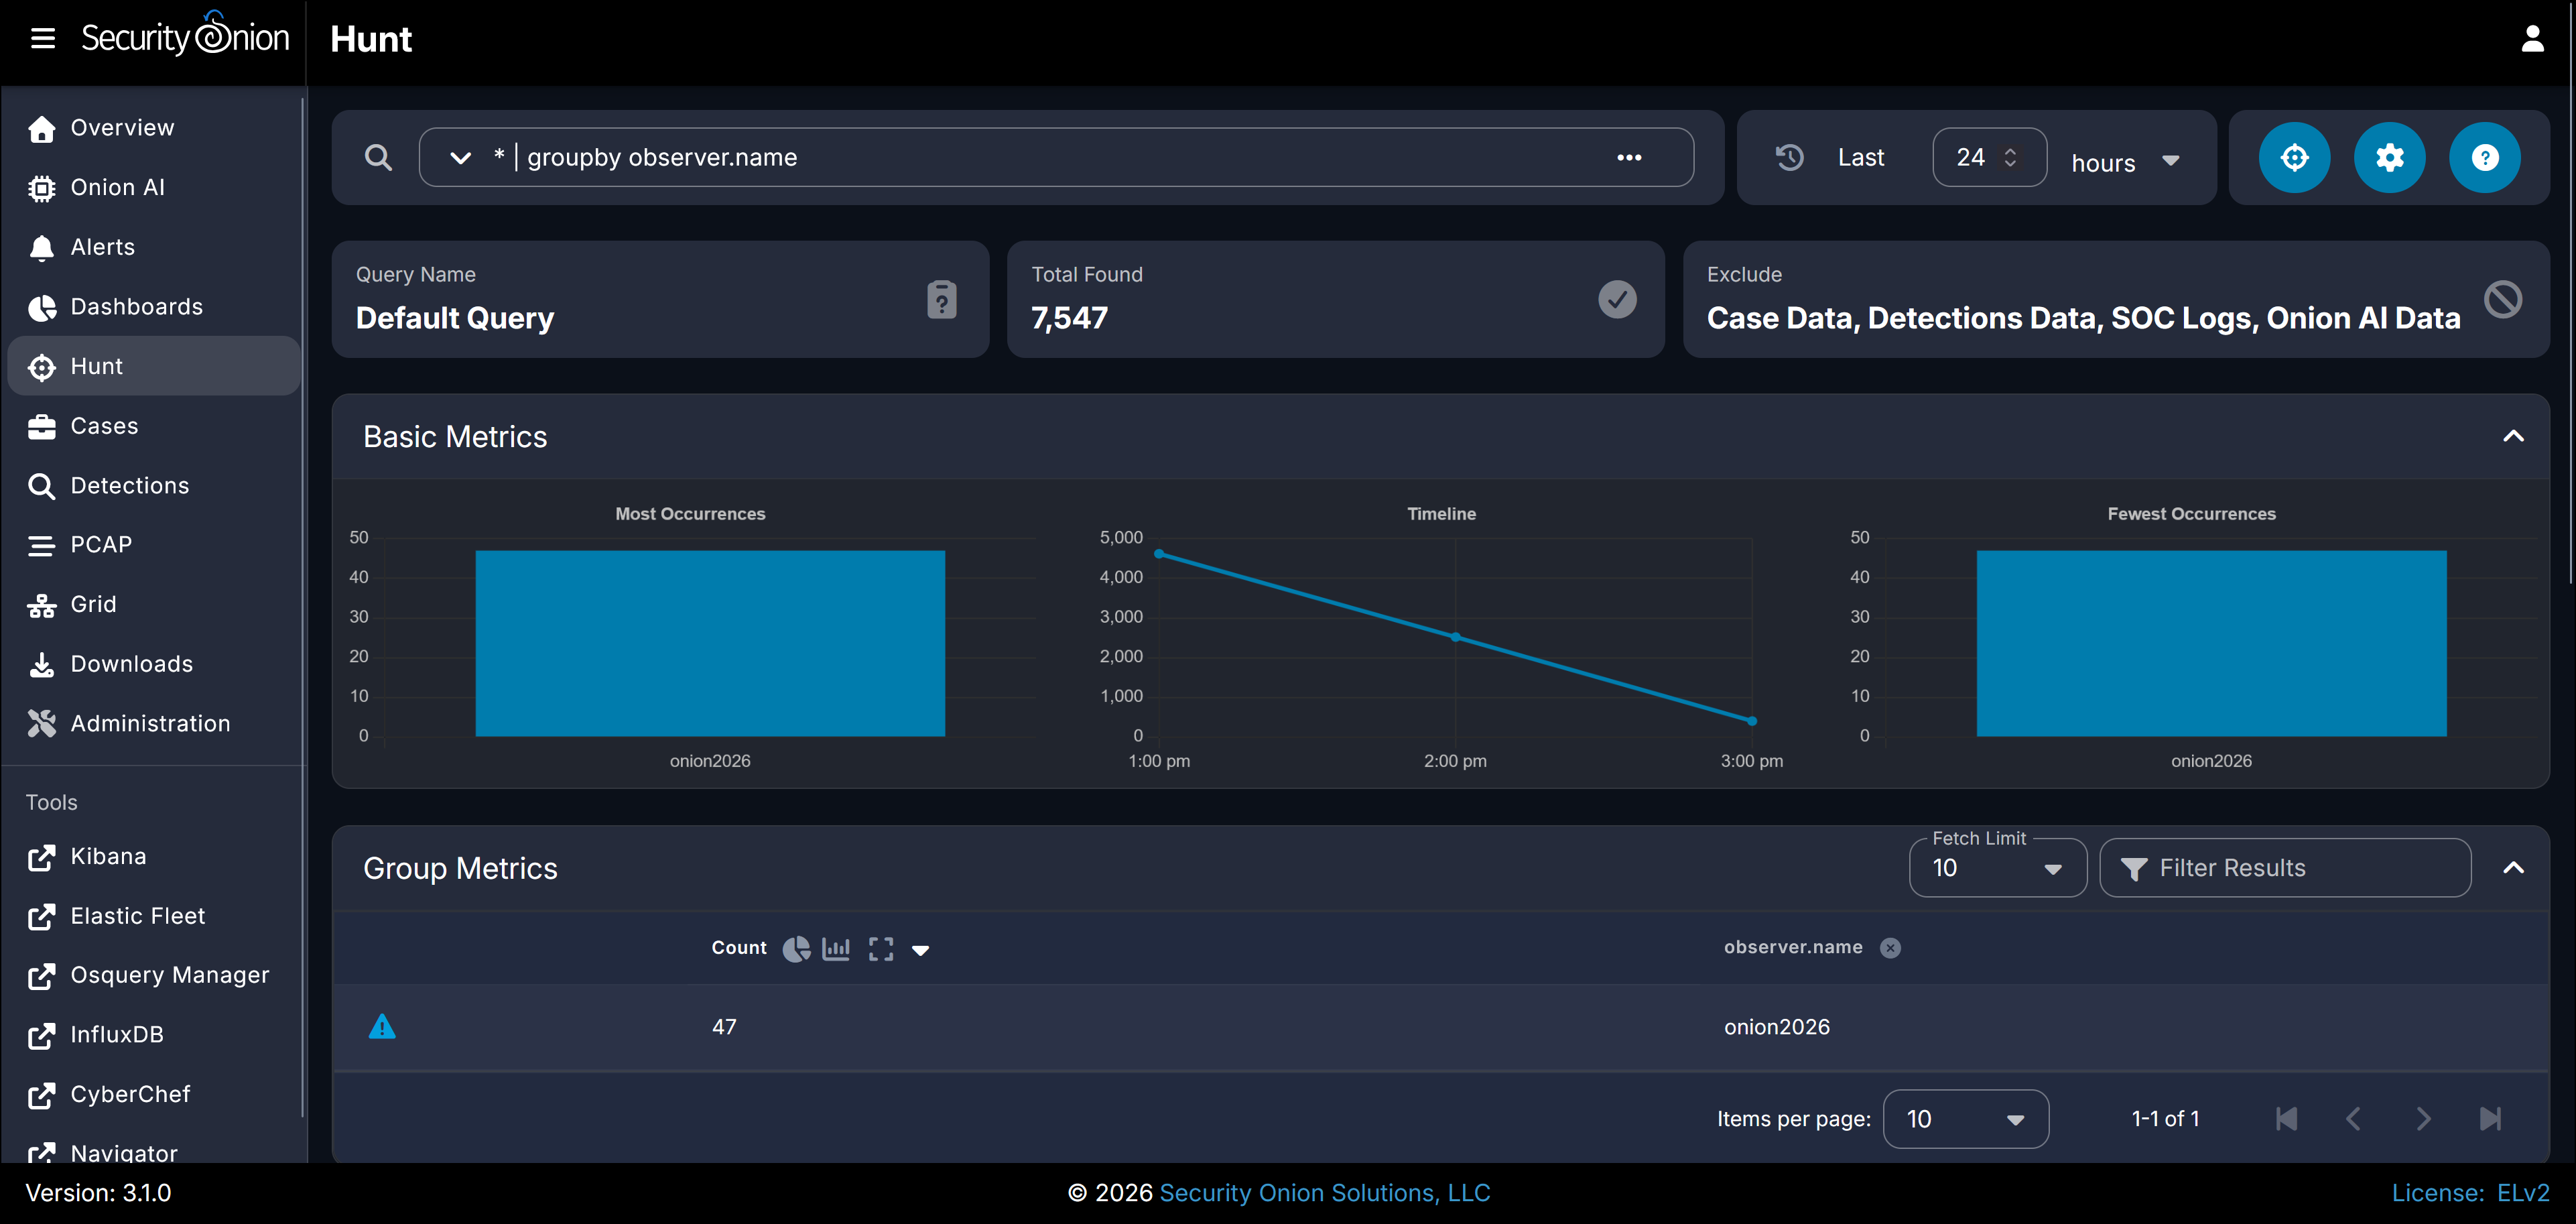
- The Hunt page, where you can compare different events as part of investigations and incident response.
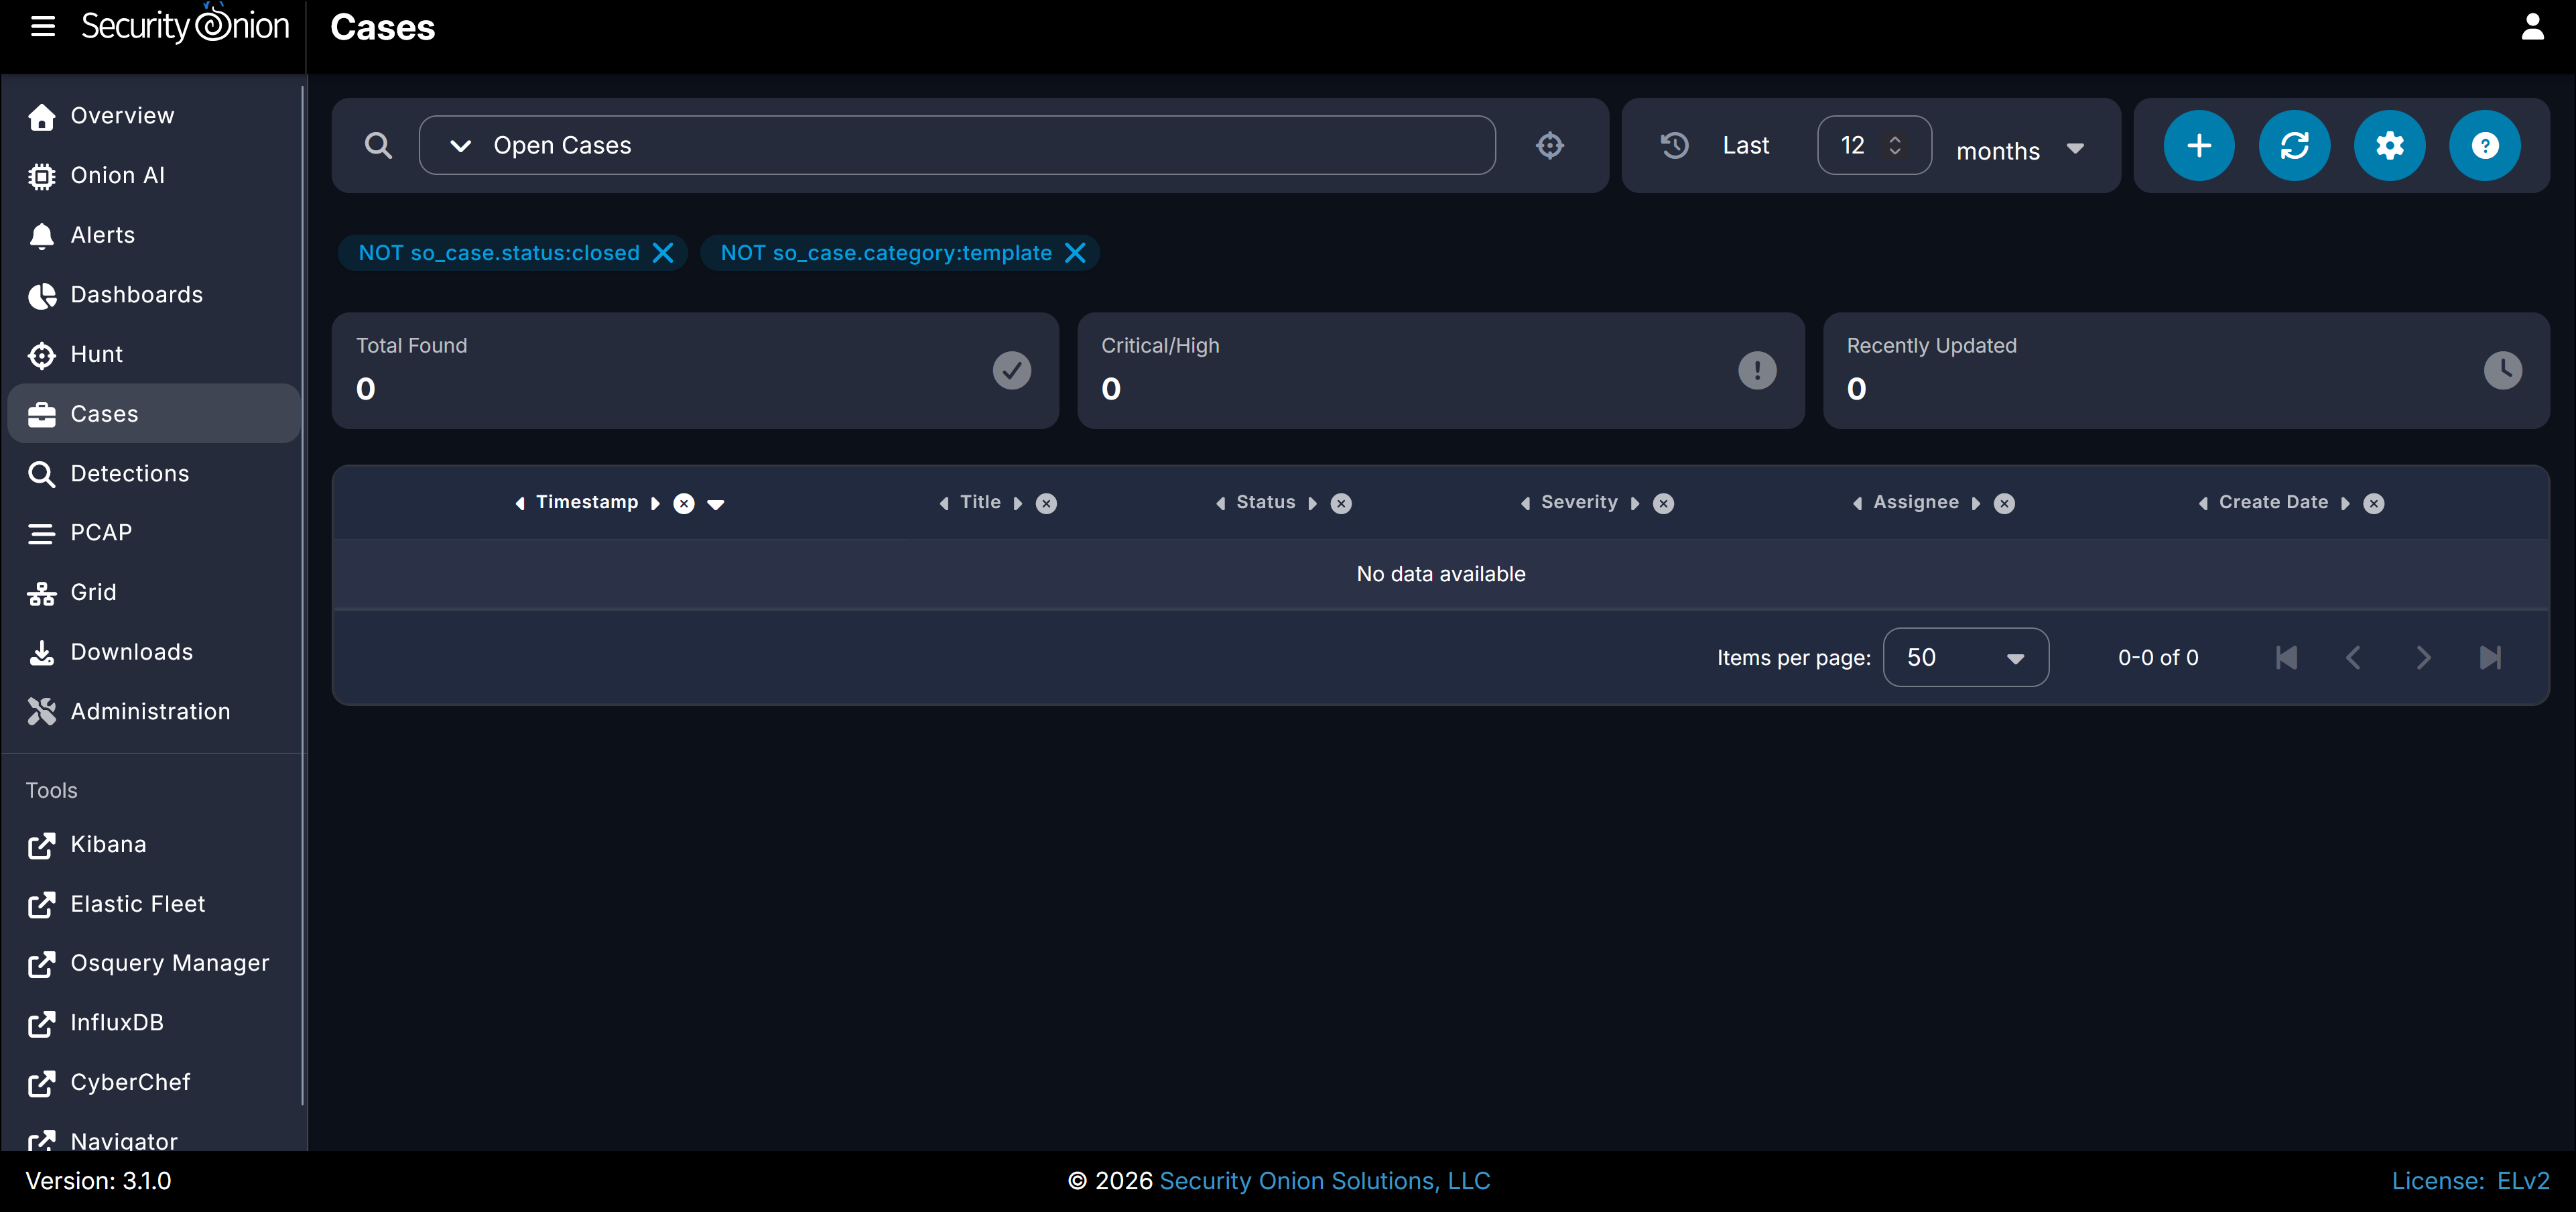
- The Cases page. “Cases” are events that you can create when browsing the Alerts, Dashboard, or Hunt pages.
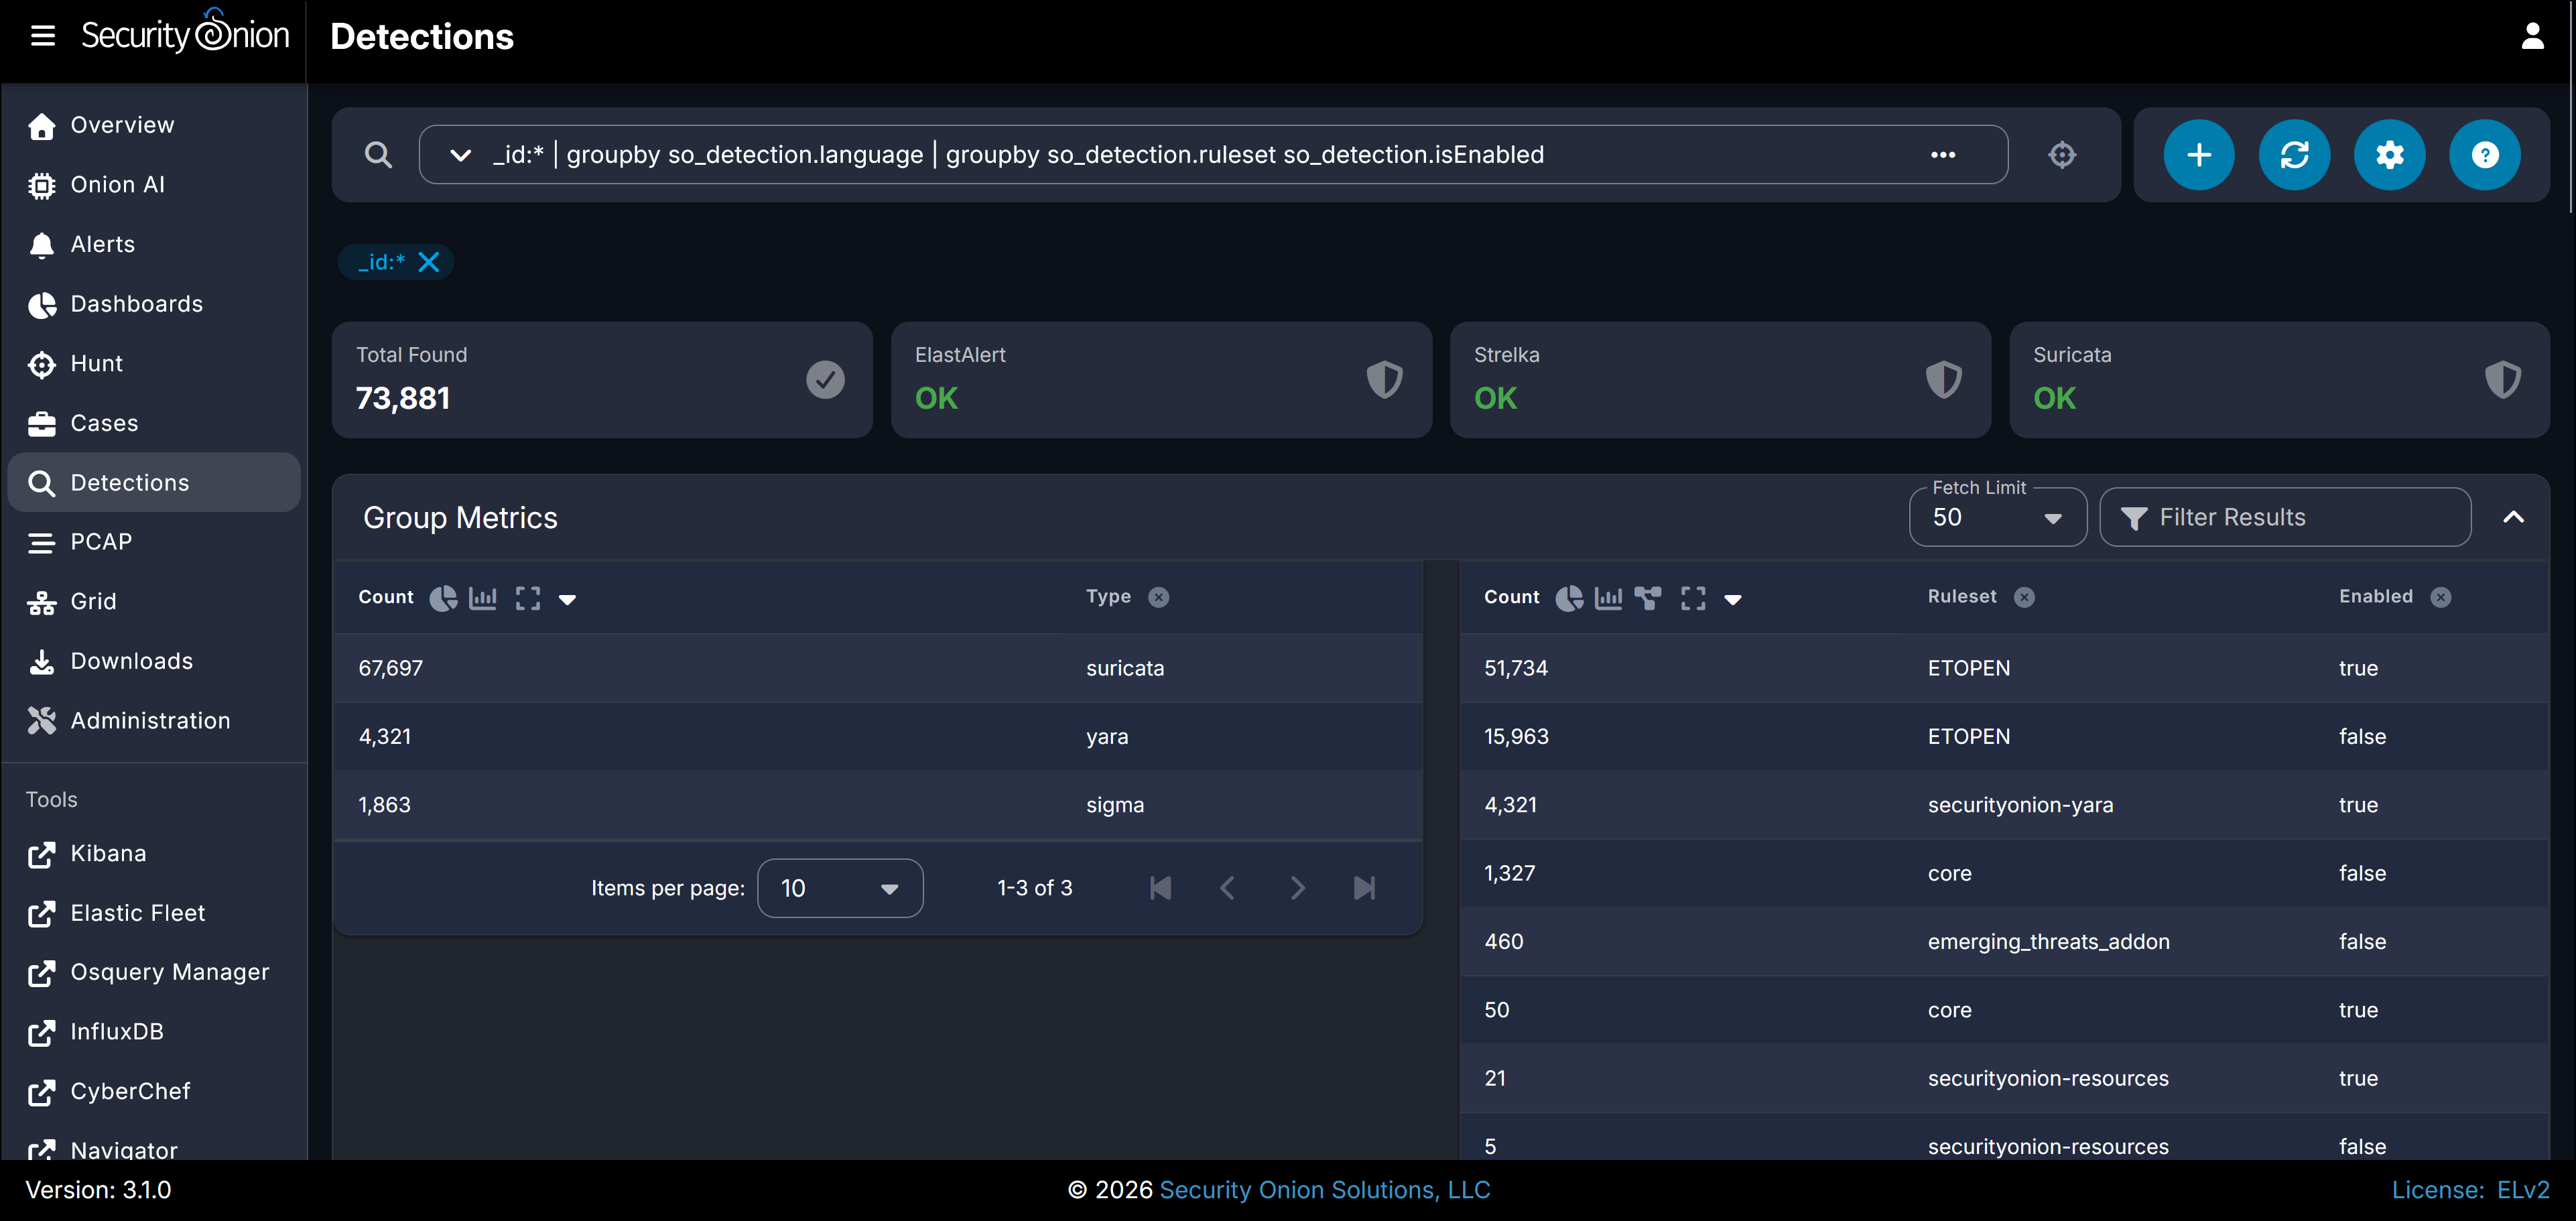
- The Detections page allows you to manage the detection engineering rules running in Security Onion. These include the network events in Suricata, Sigma rules used by ElastAlert, and file-scanning rules used by a tool called Strelka.
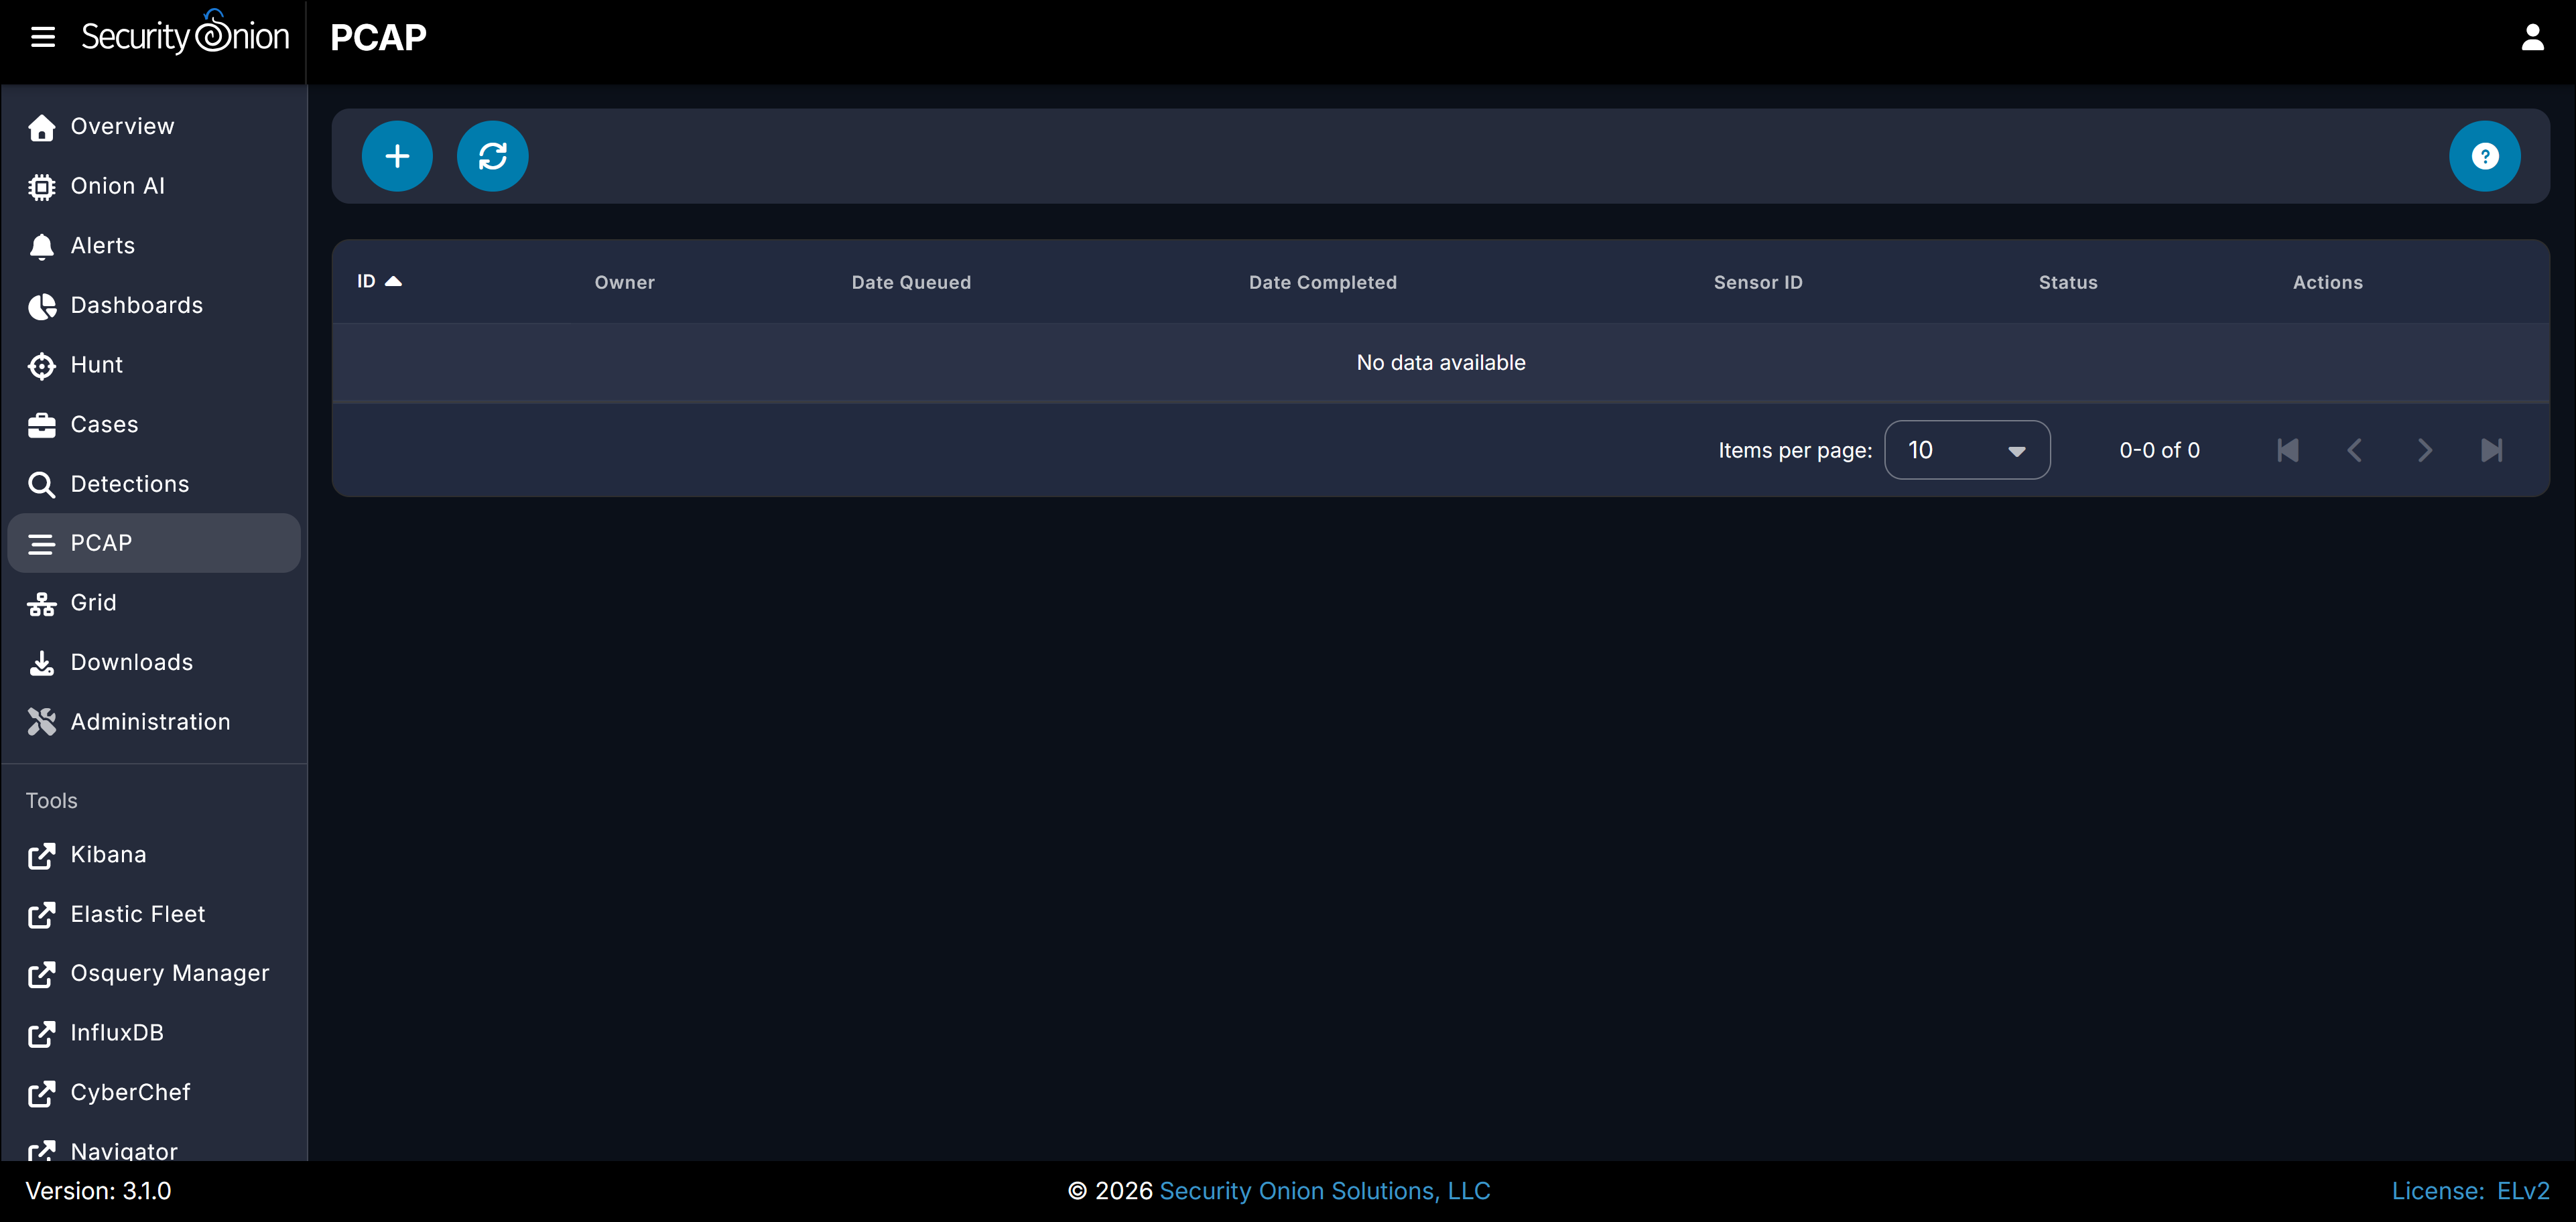
- The PCAP page for capturing and replaying packet captures (PCAPs).
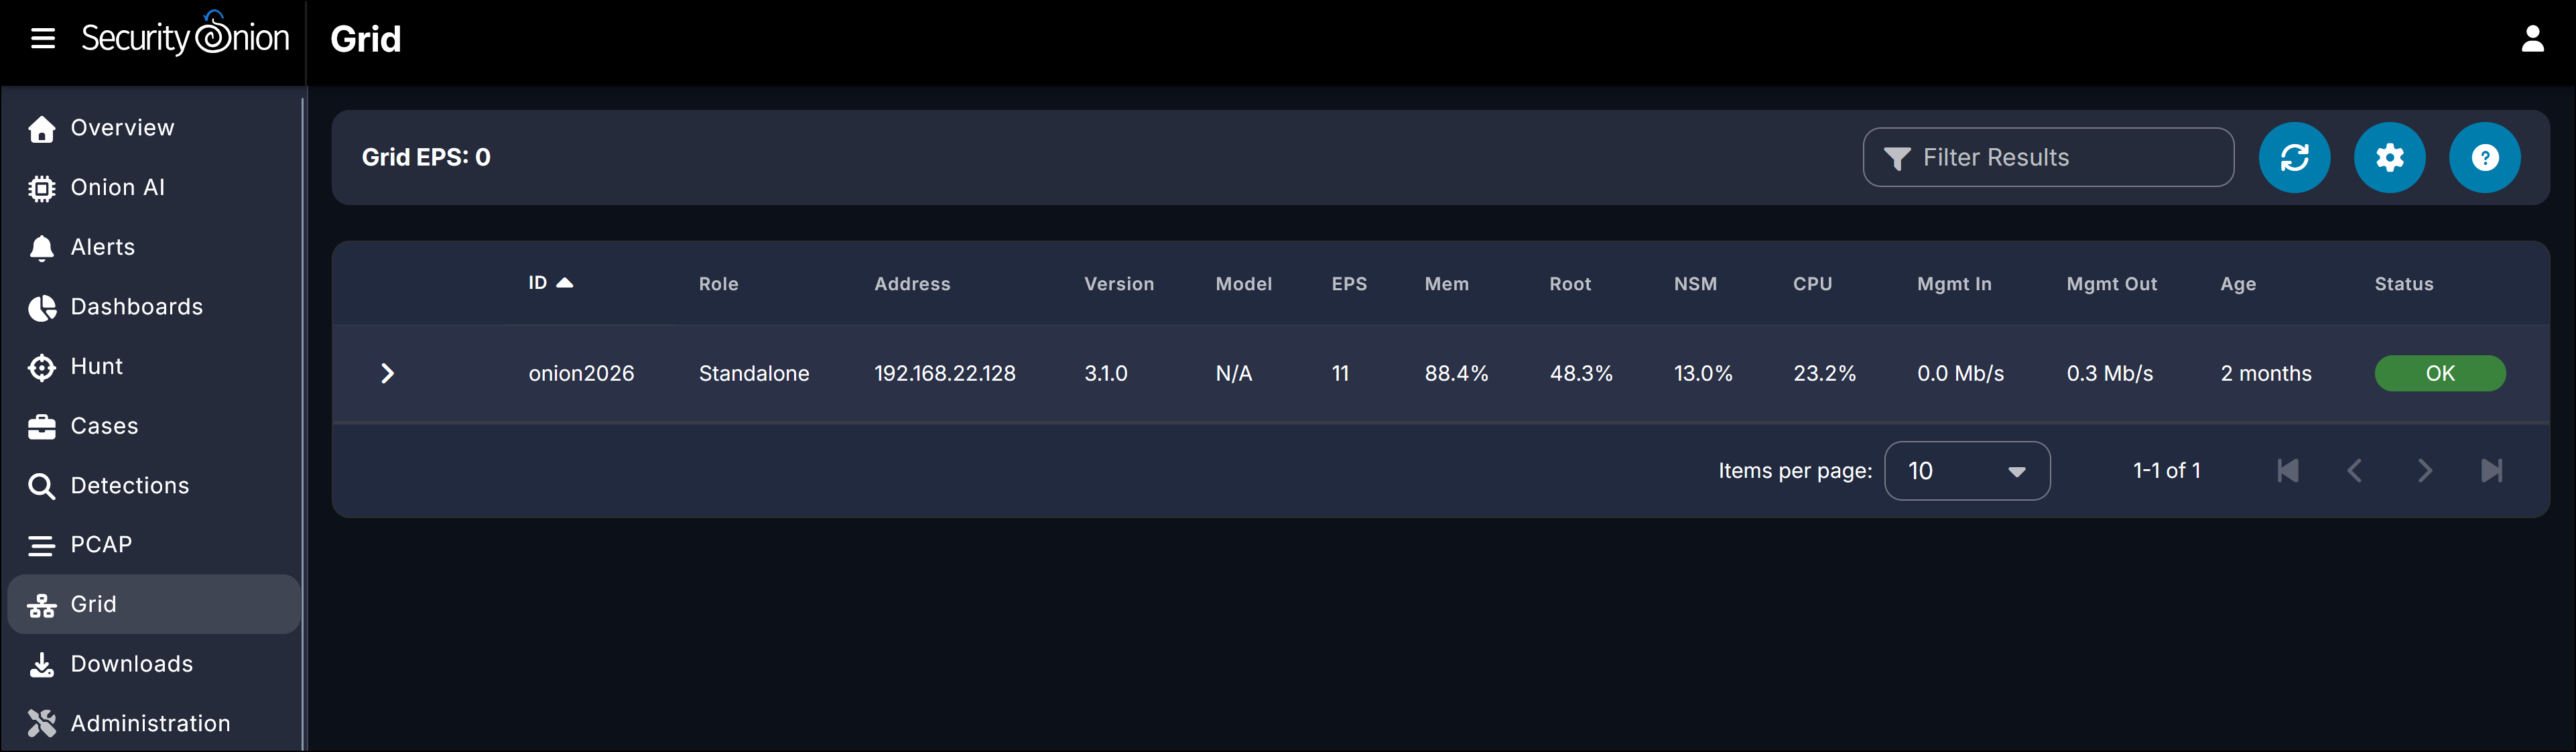
- The Grid page lets you check the operational status of the Security Onion and its components. In this series, I only have a single host, or a “standalone deployment.” When there are Security Onion hosts, that’s a distributed deployment.
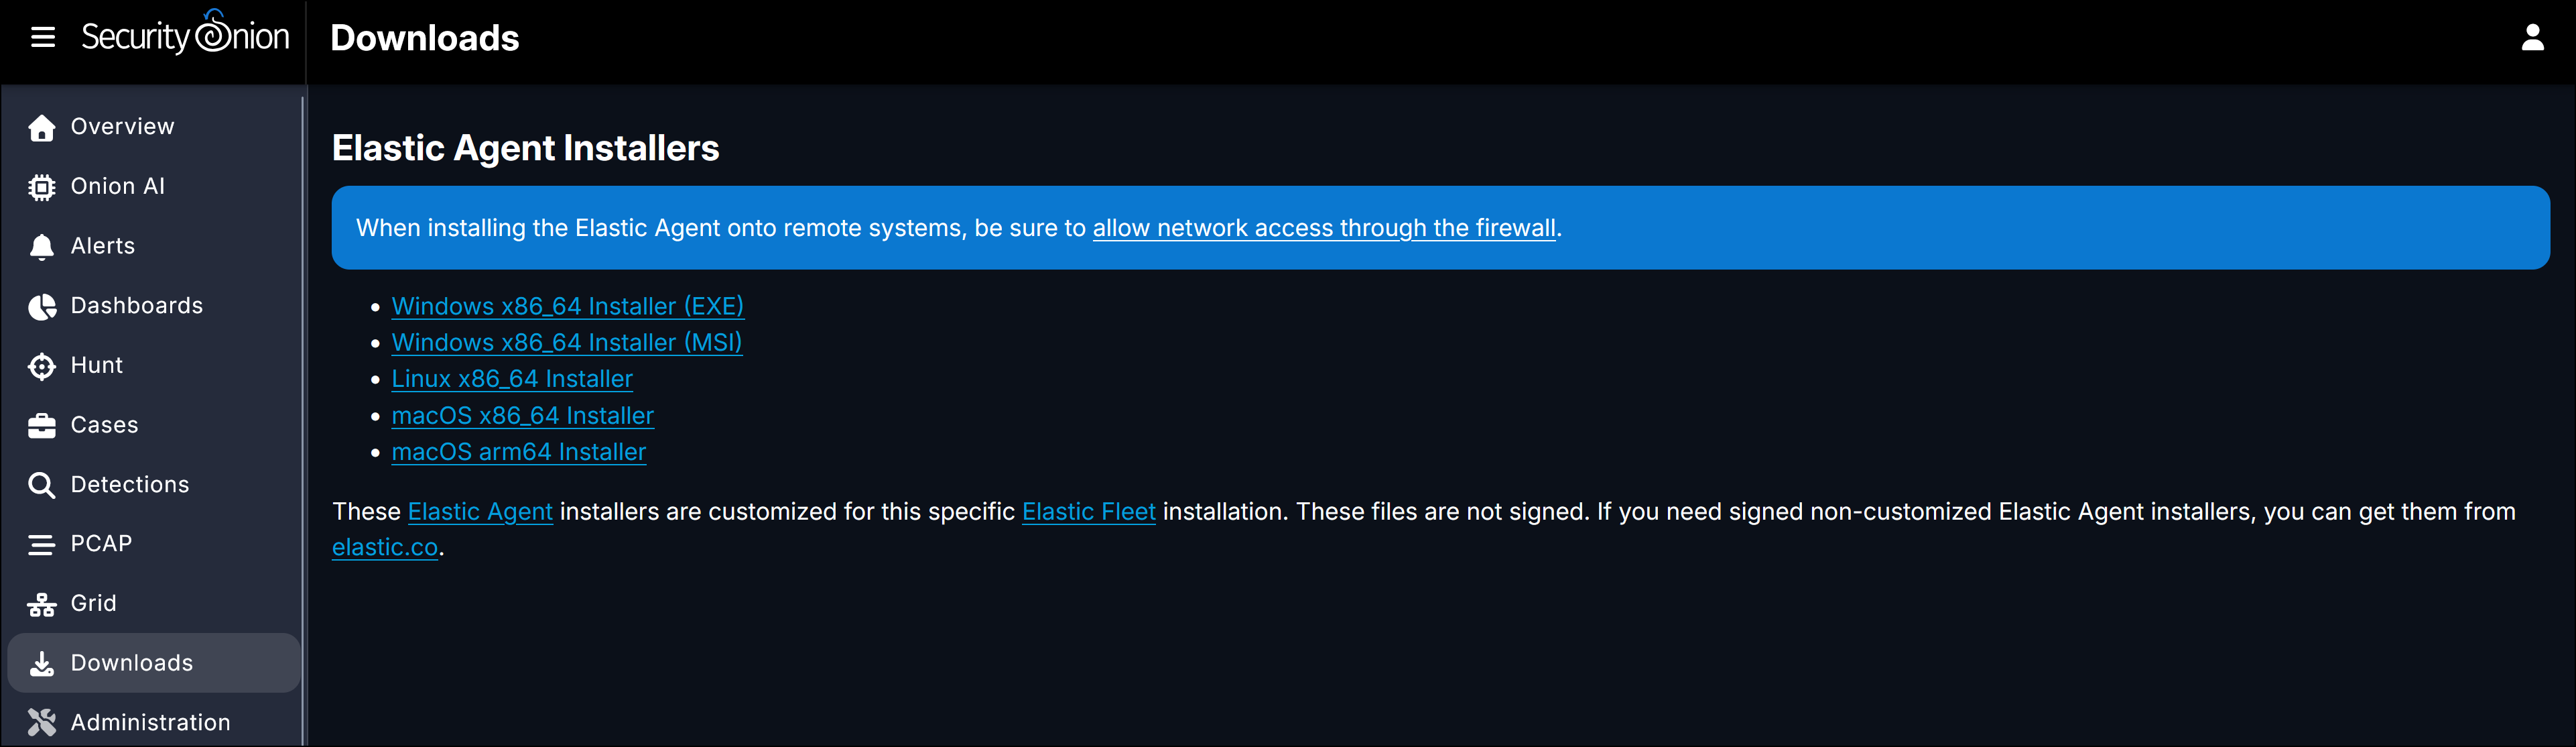
- The Downloads page contains links to download Elastic Agent installers which are ready to be installed on the hosts covered by your Security Onion deployment.
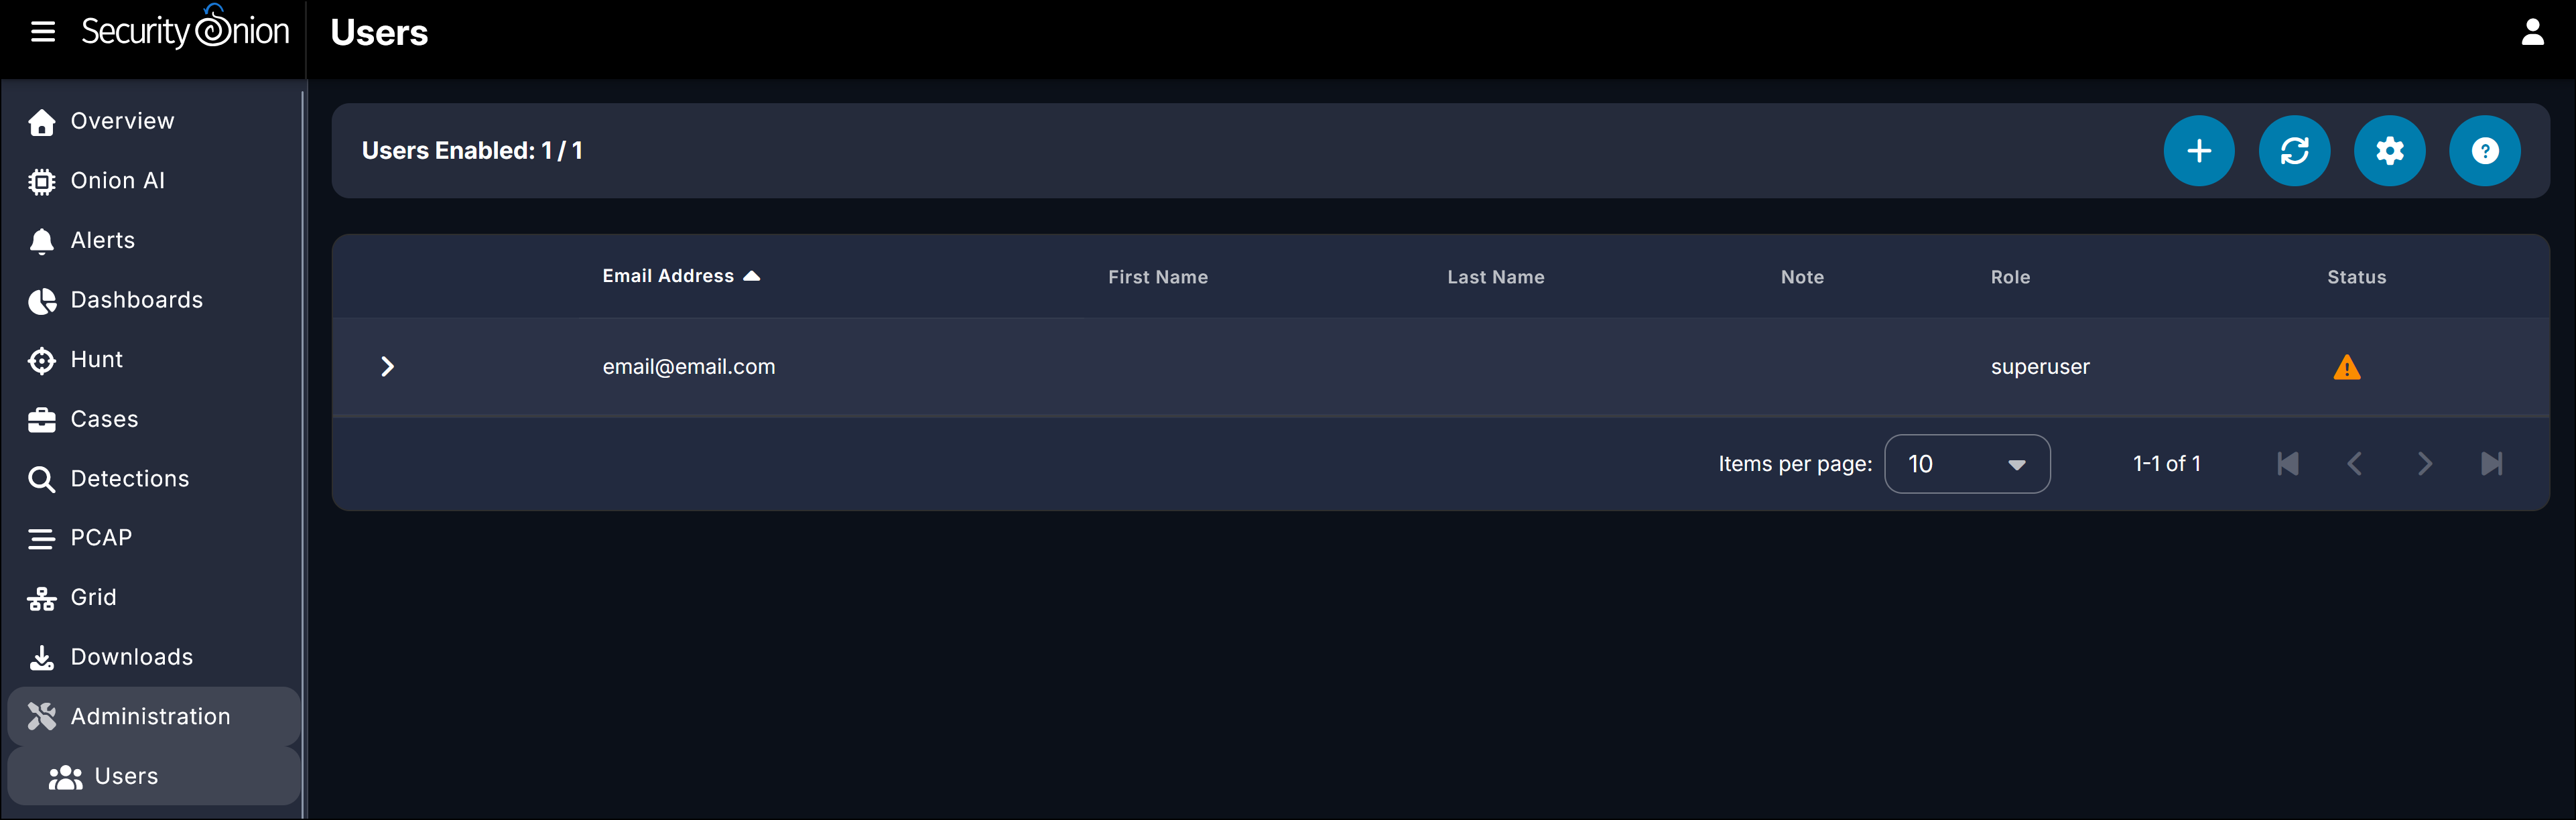
- The Administration page is where you can manage user accounts to access the Security Onion Console.
-
Additional Tools that extend what you can do with Security Onion:
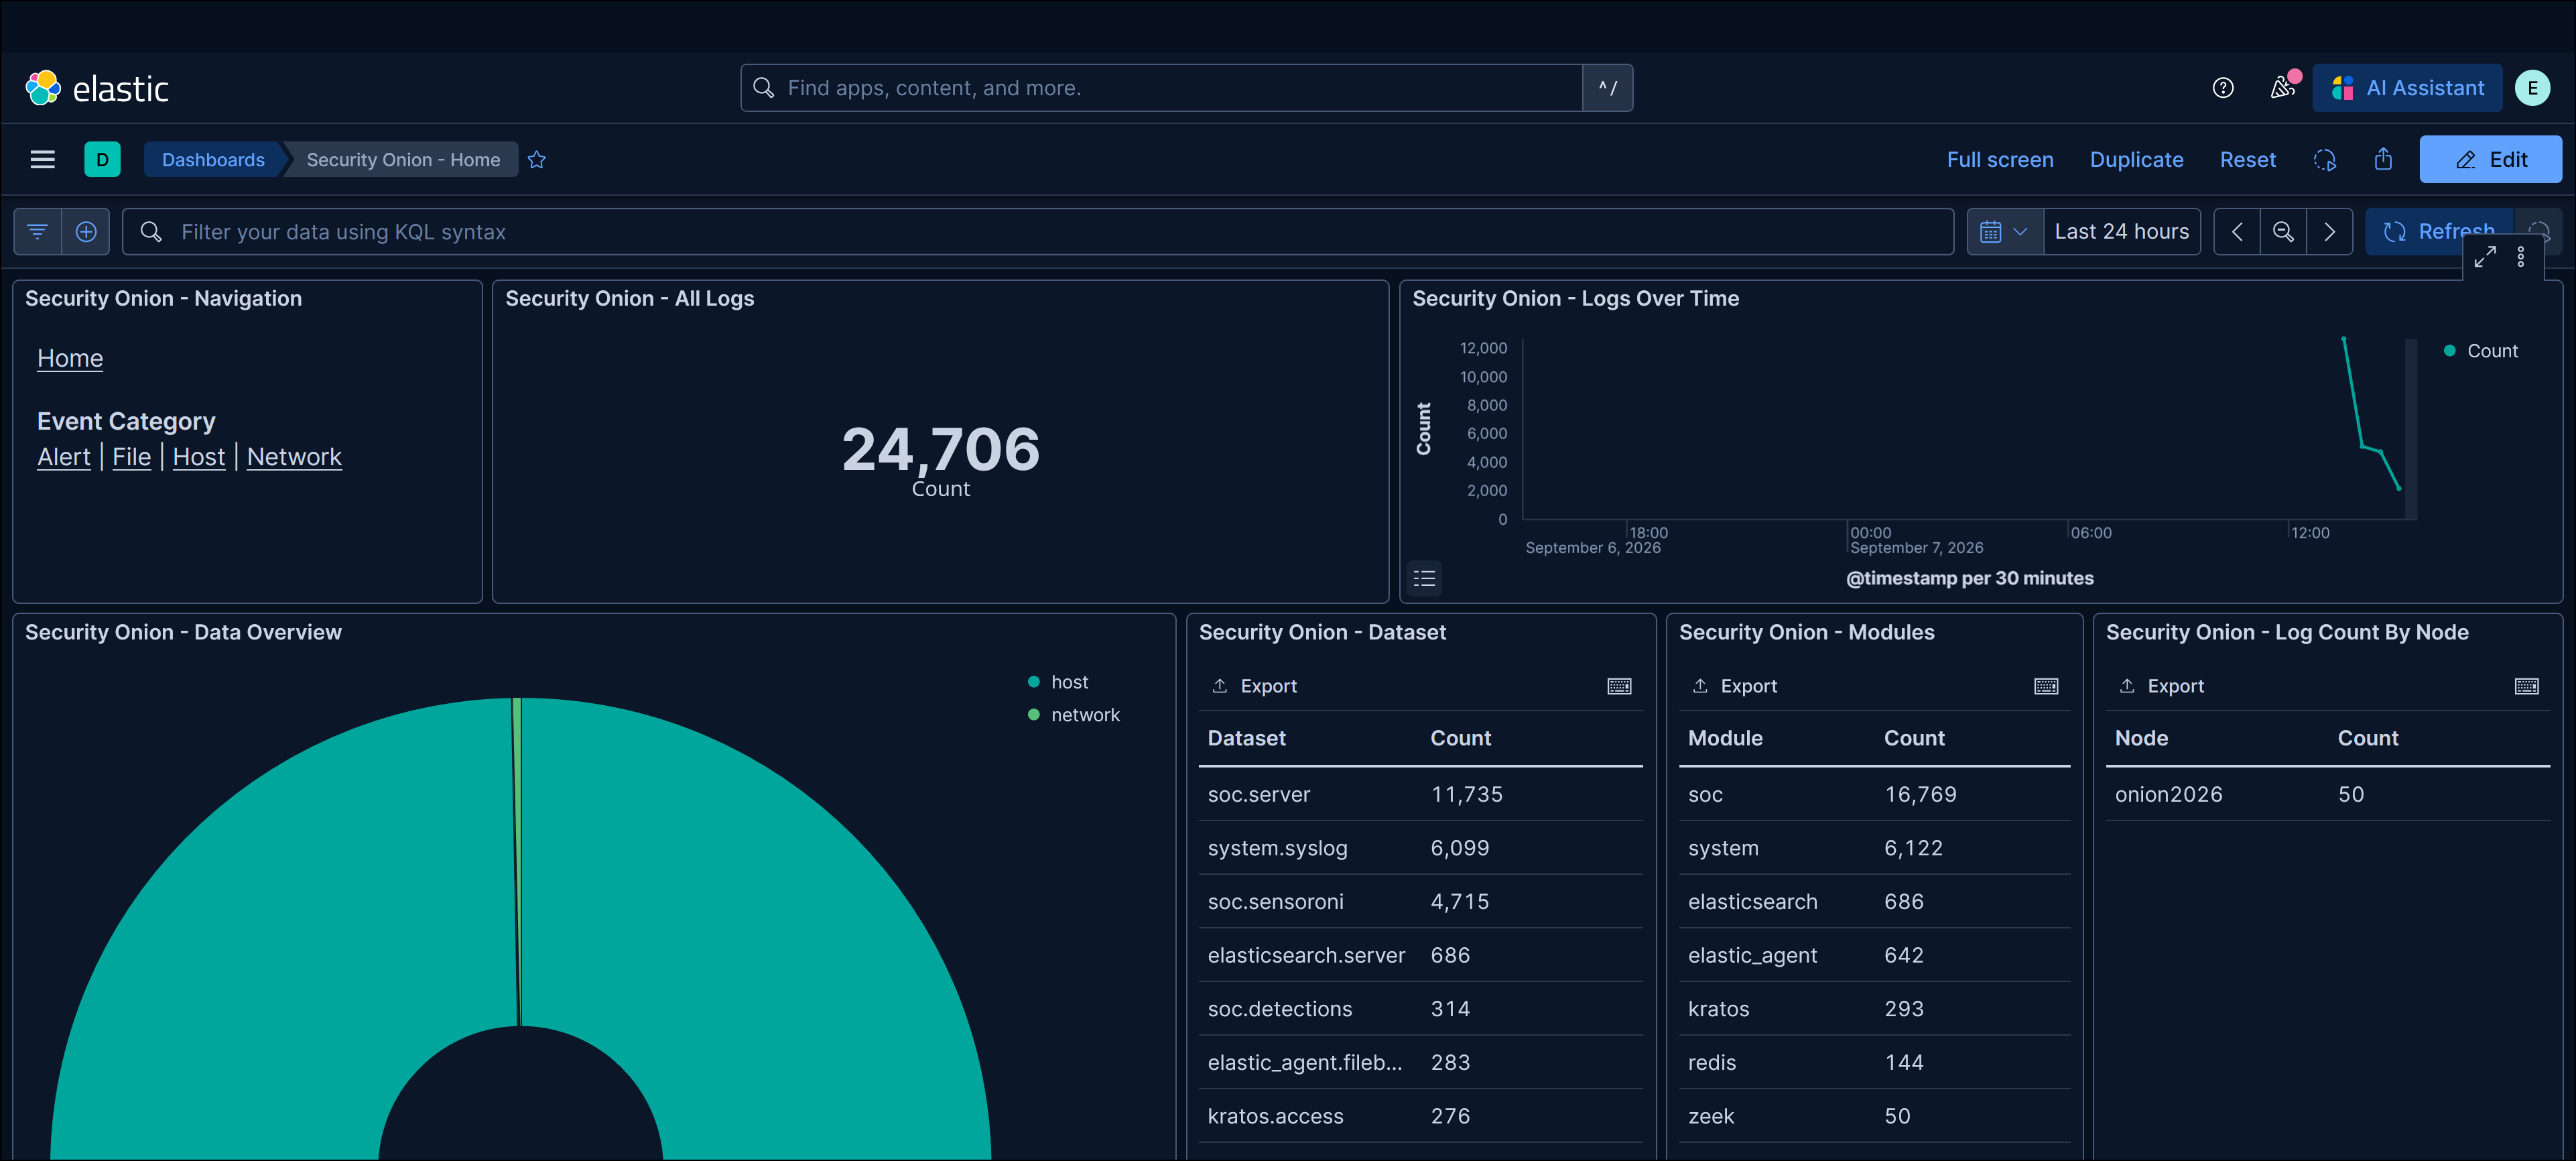
- A Kibana instance that provides security information and event management (SIEM) functionality.
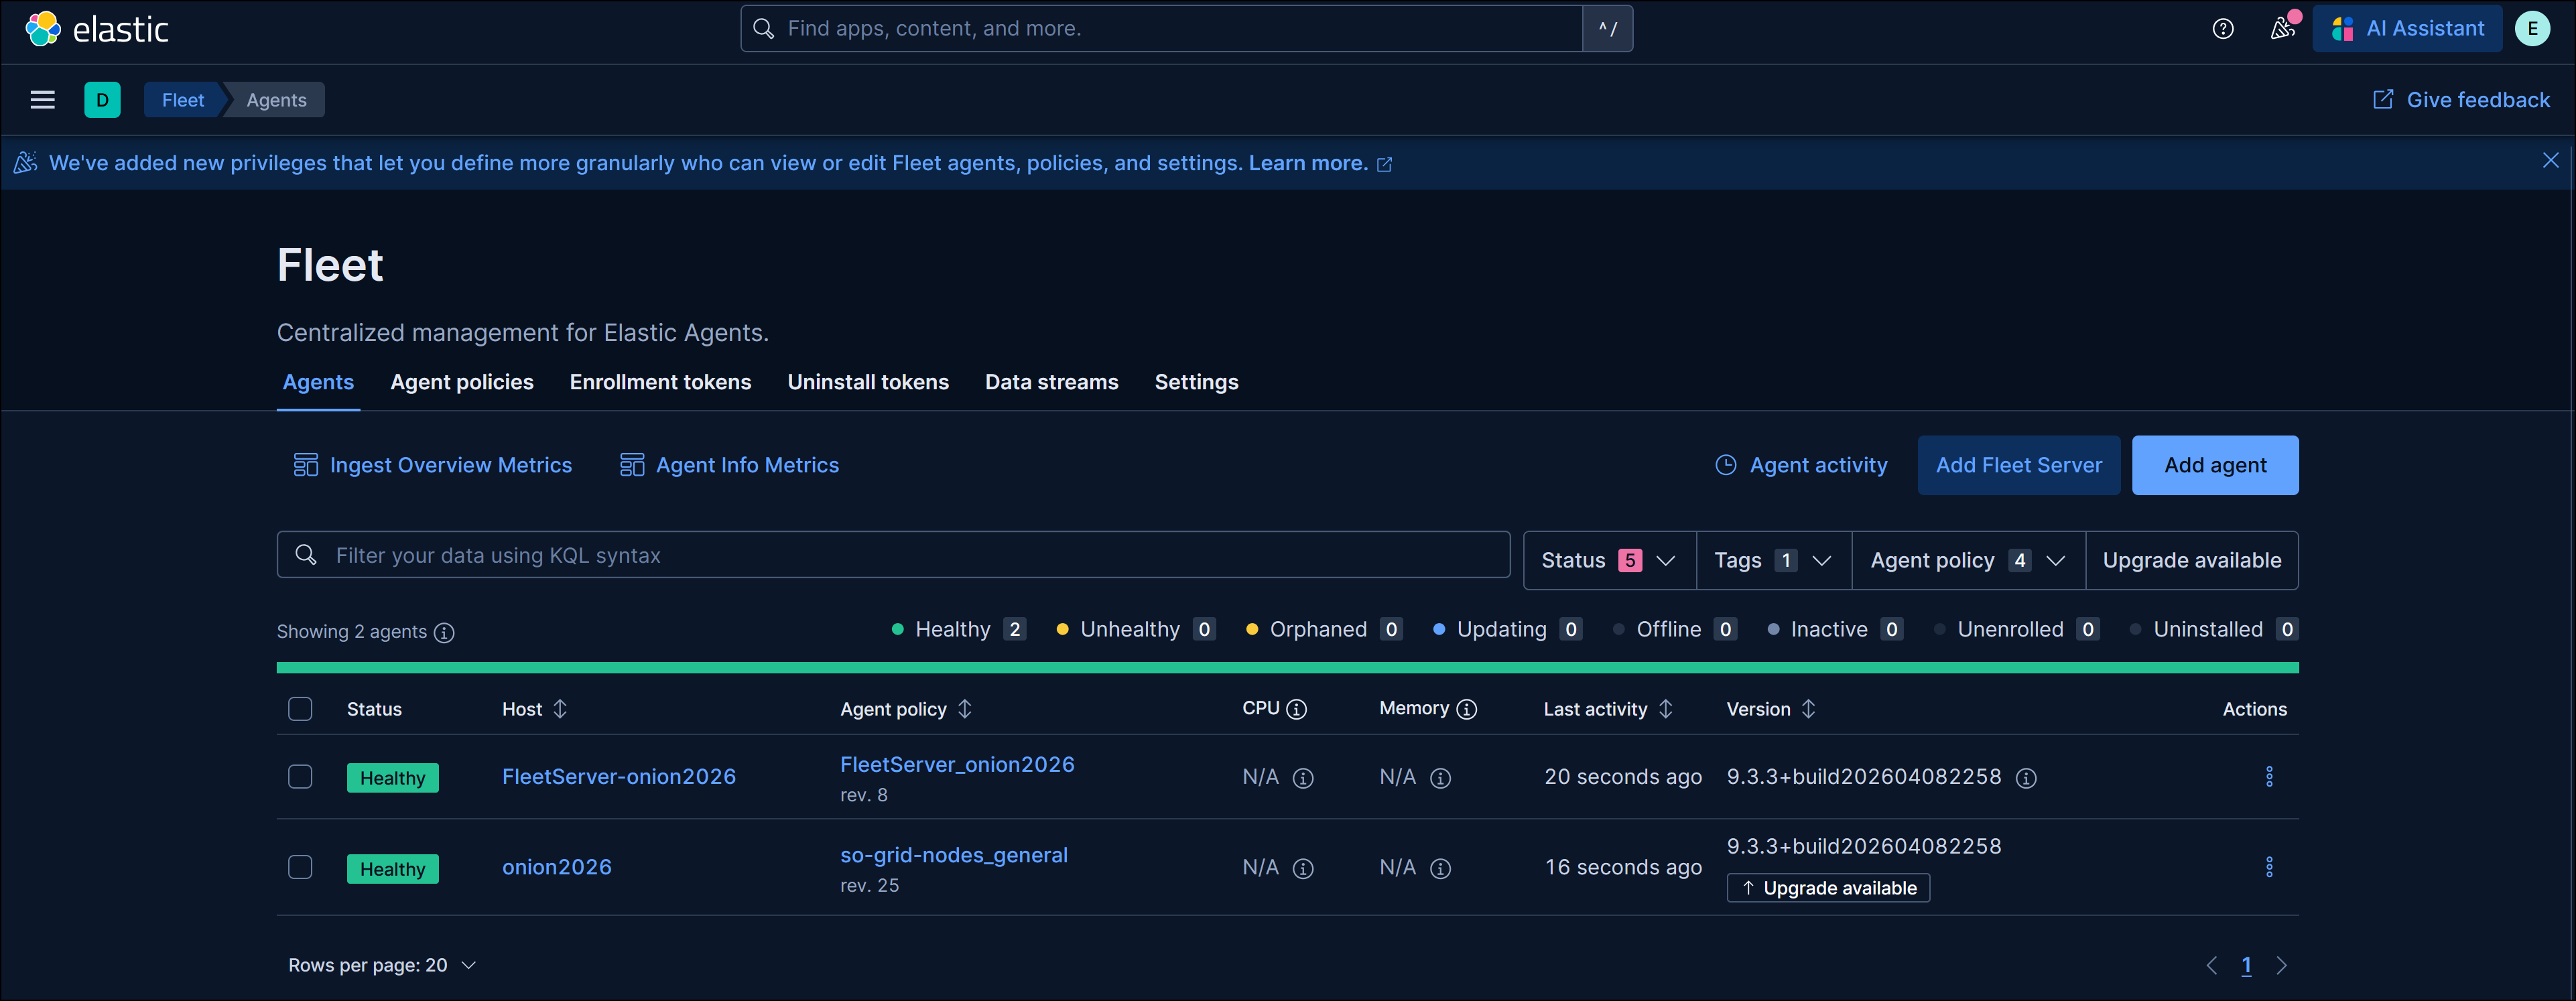
- The Elastic Fleet link takes you to a Kibana page where you can manage the different components of your Elastic deployment, such as the agents installed on hosts that send log data to the Elastic server and the Elastic server itself.
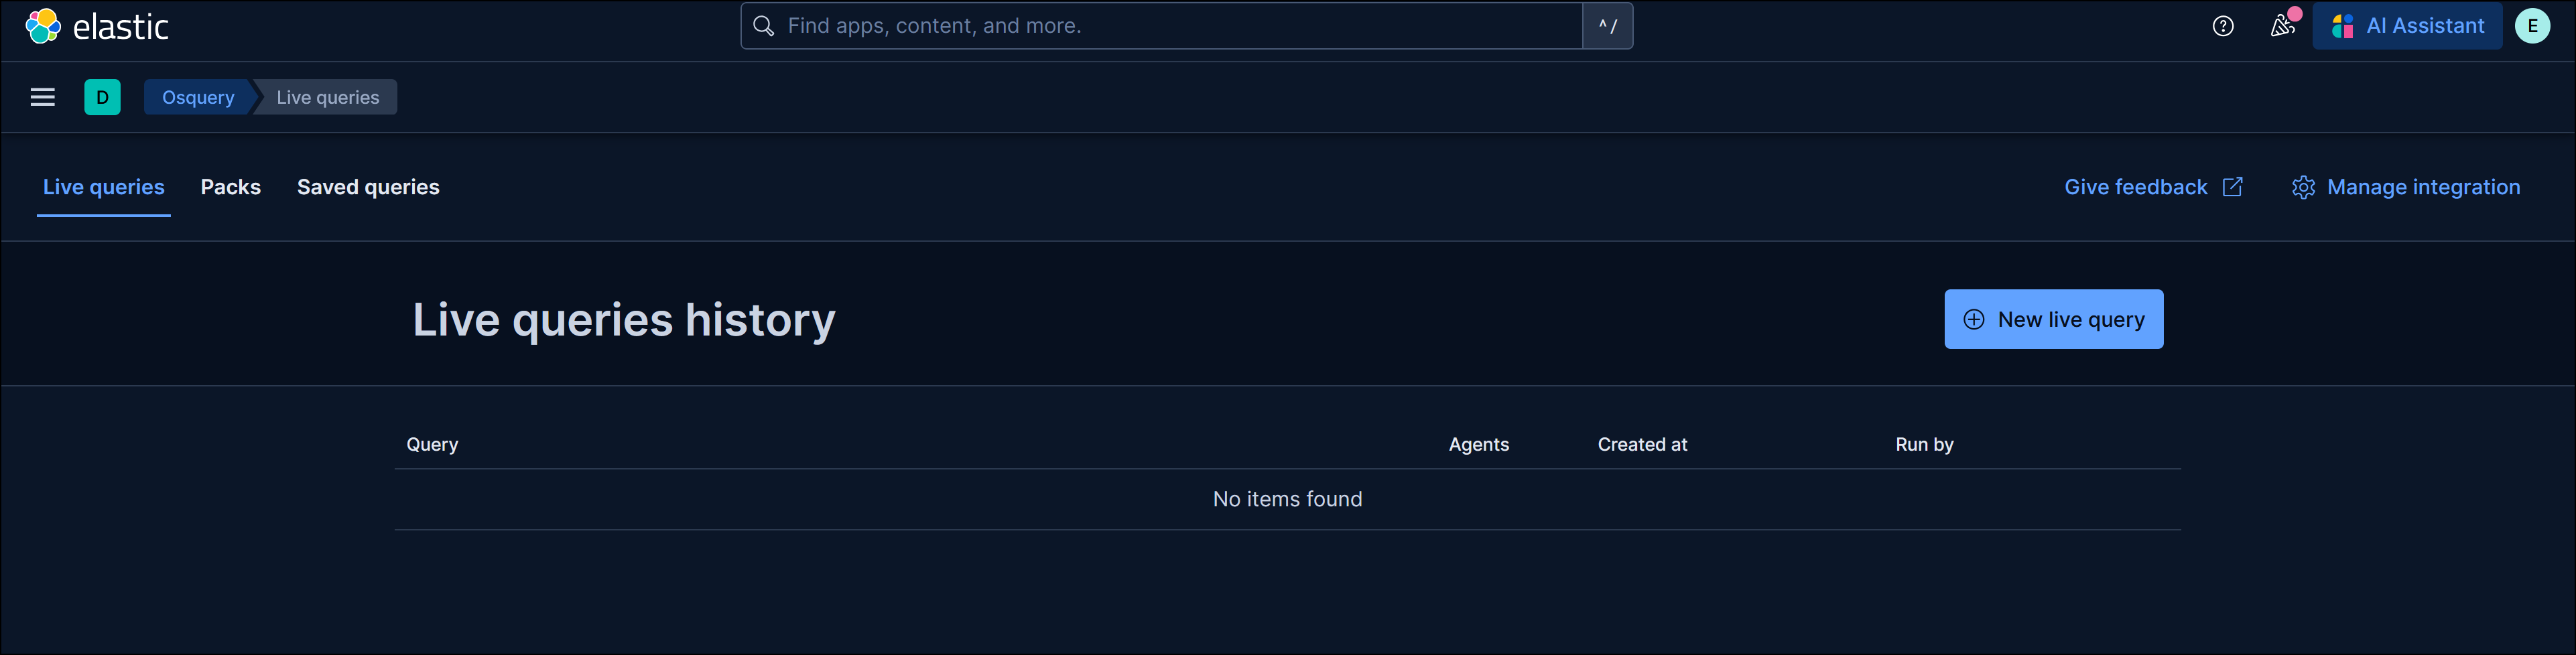
- The Osquery Manager link takes you to another Kibana page where you can manage an integration with feature that integrates osquery, which “allows you to write SQL queries to explore operating system data.” The individual Elastic Agents in your fleet can use osquery to check the states of the hosts they are installed on.
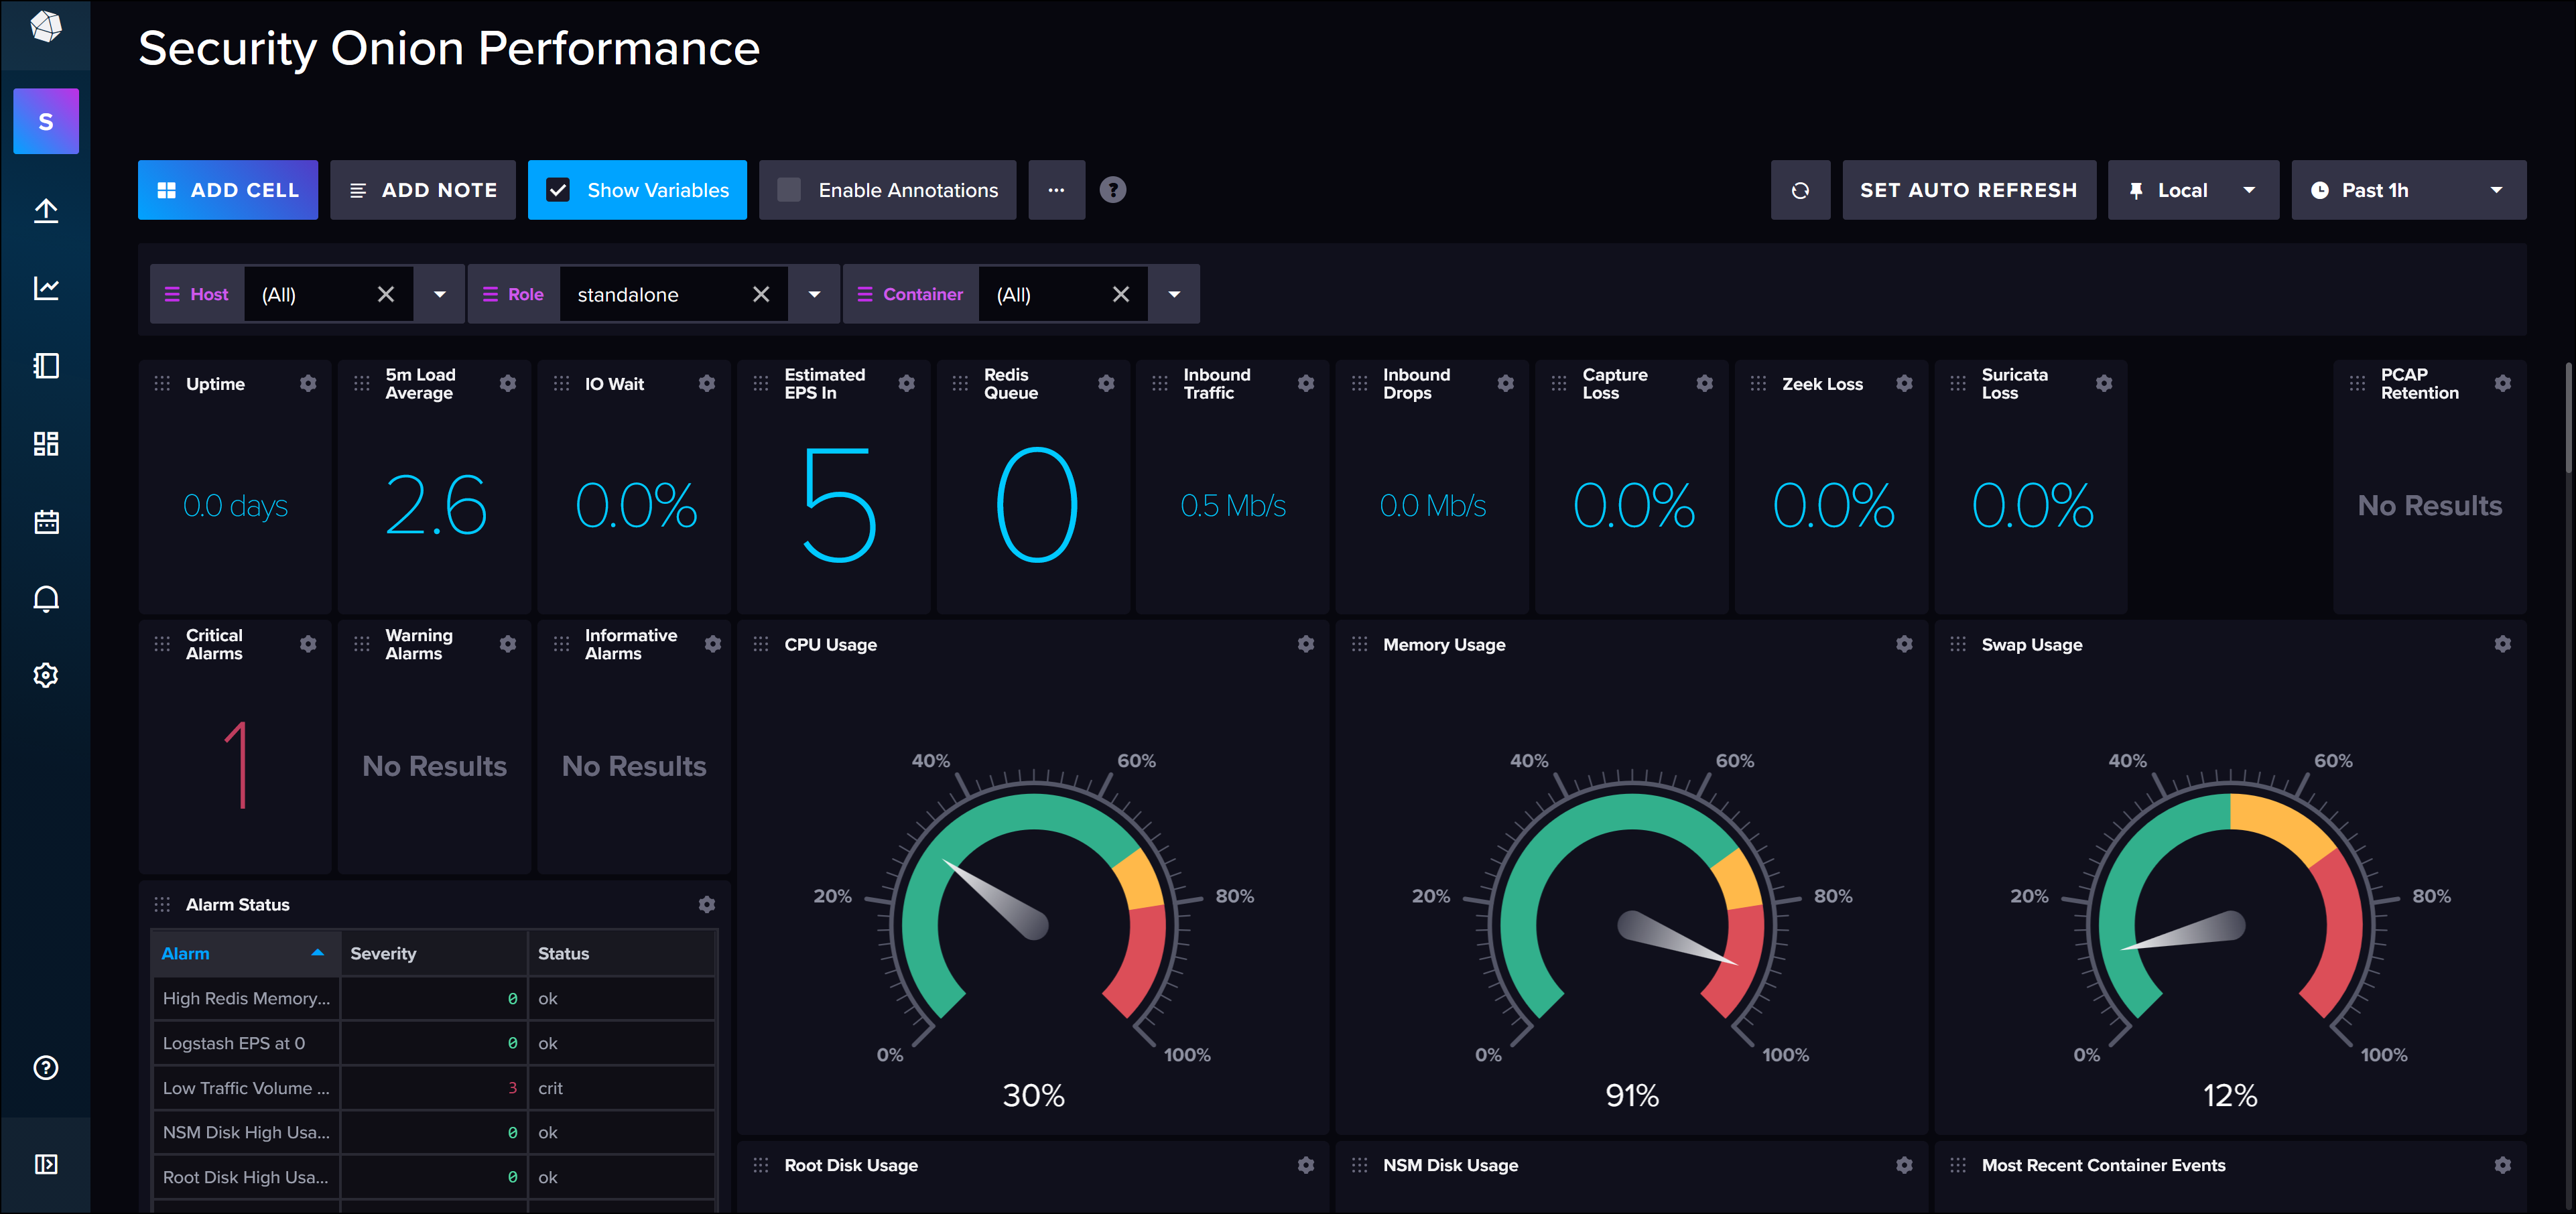
- InfluxDB is an observability tool that provides visualizations of the state of your Security Onion system, with near-real-time reporting of both high-level and very granular system properties, as well as other statistics, such as network activity.
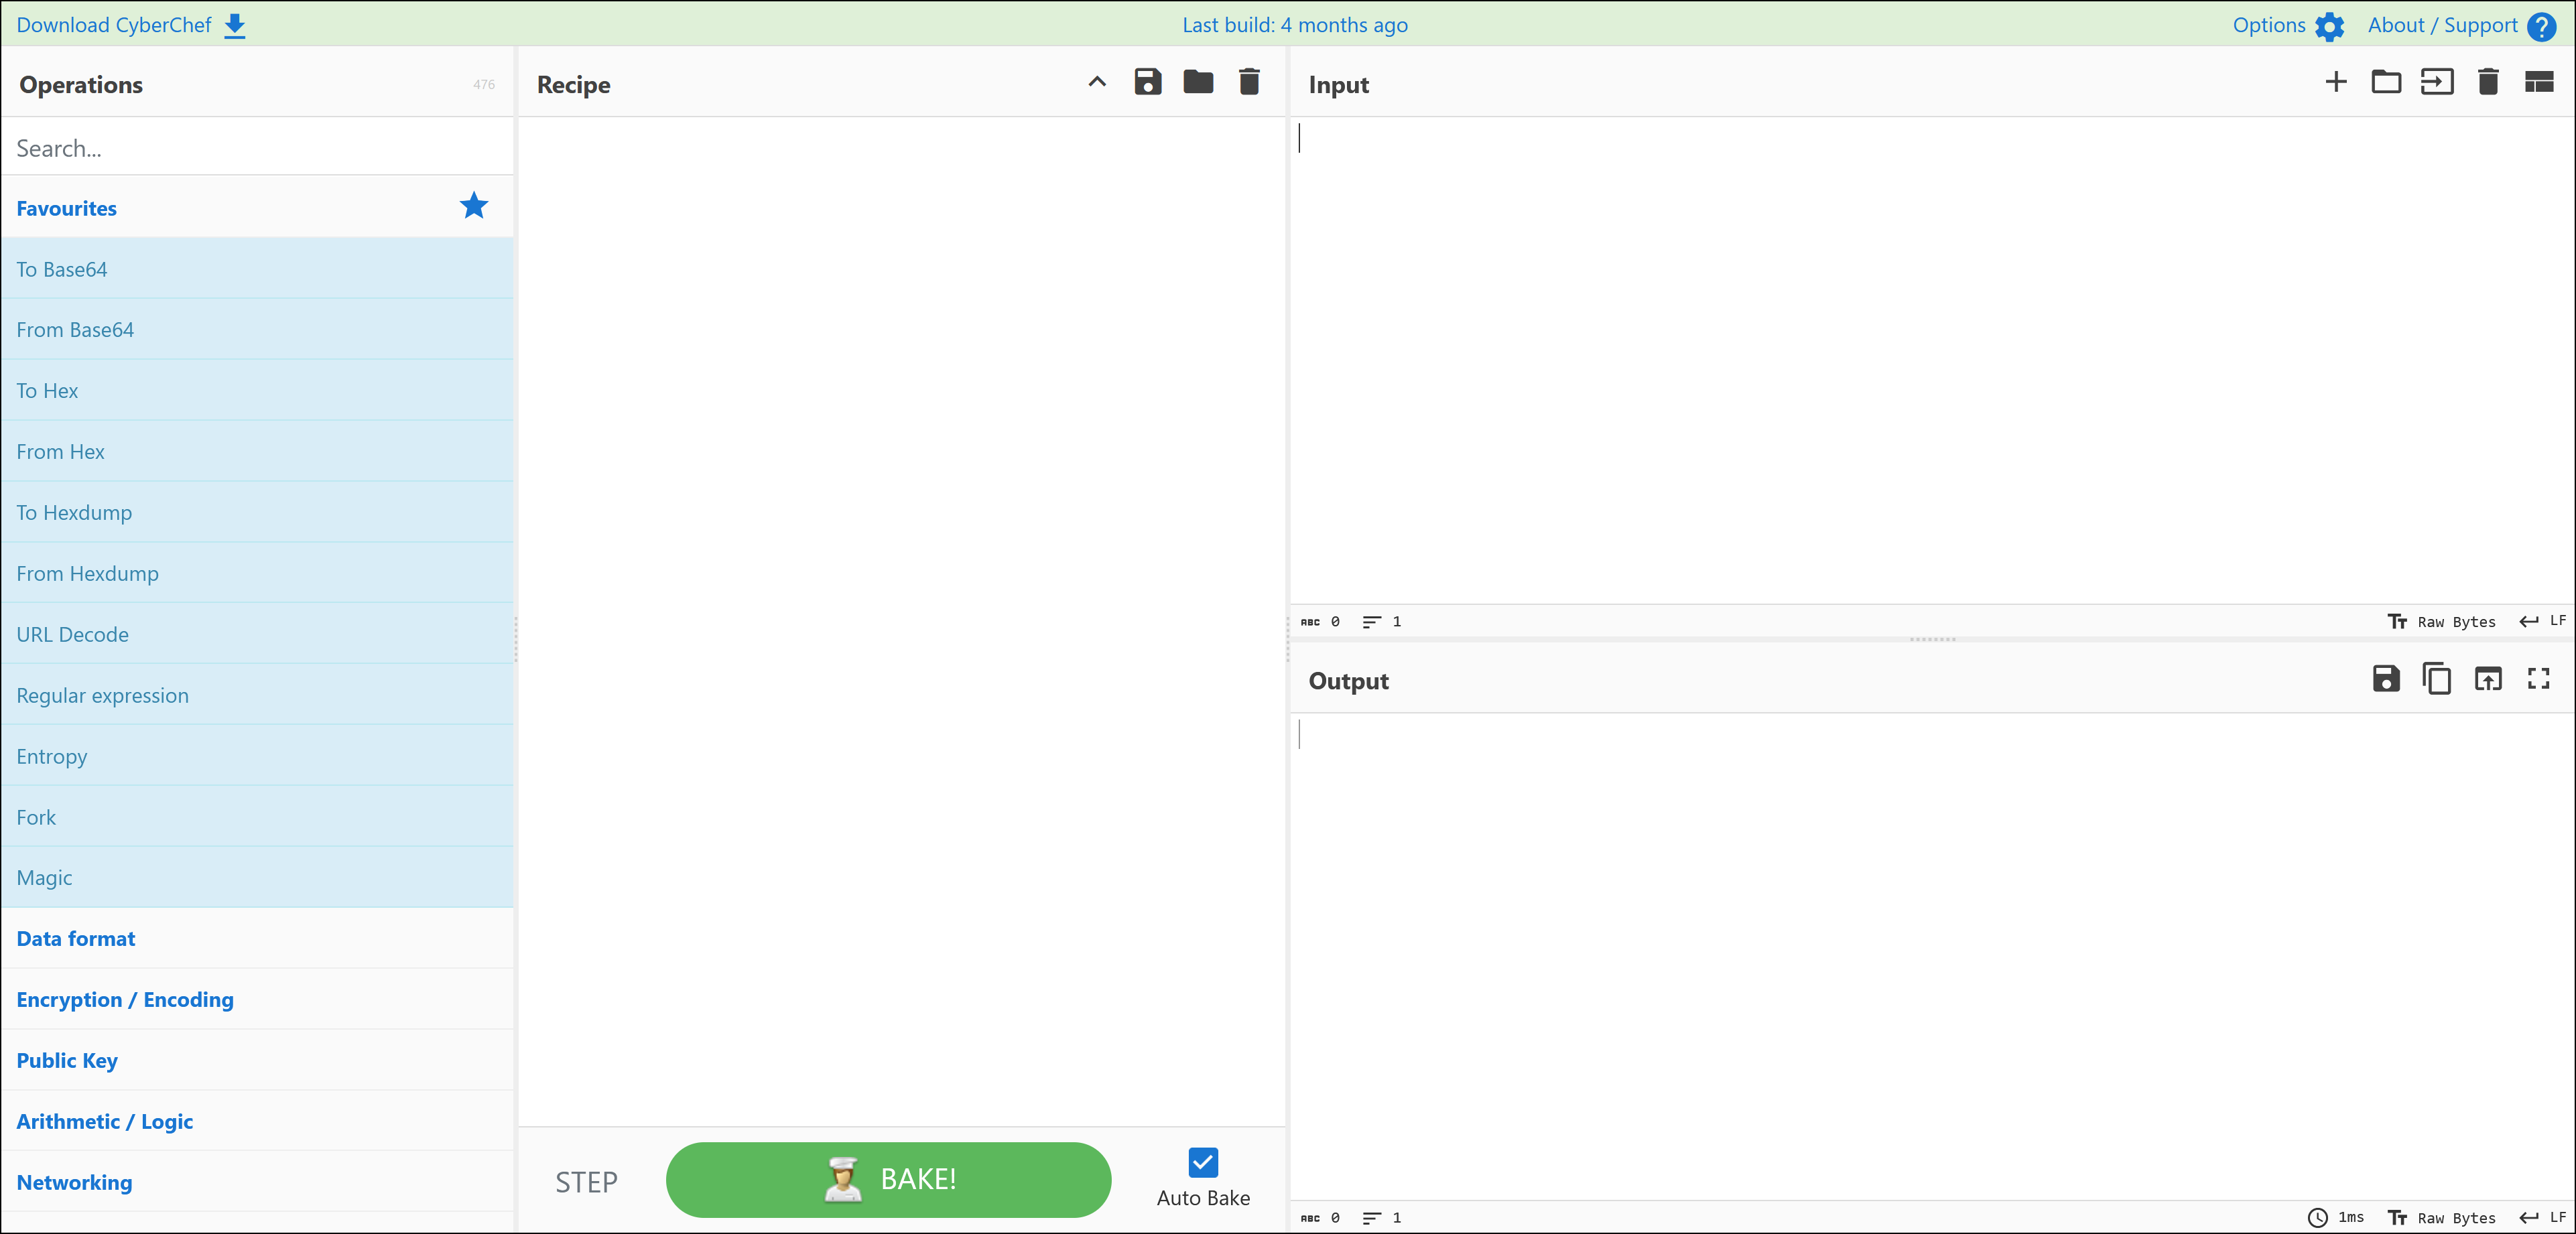
- CyberChef is an open-source project from Britain’s GCHQ, that describes itself as “The Cyber Swiss Army Knife – a web app for encryption, encoding, compression and data analysis.”
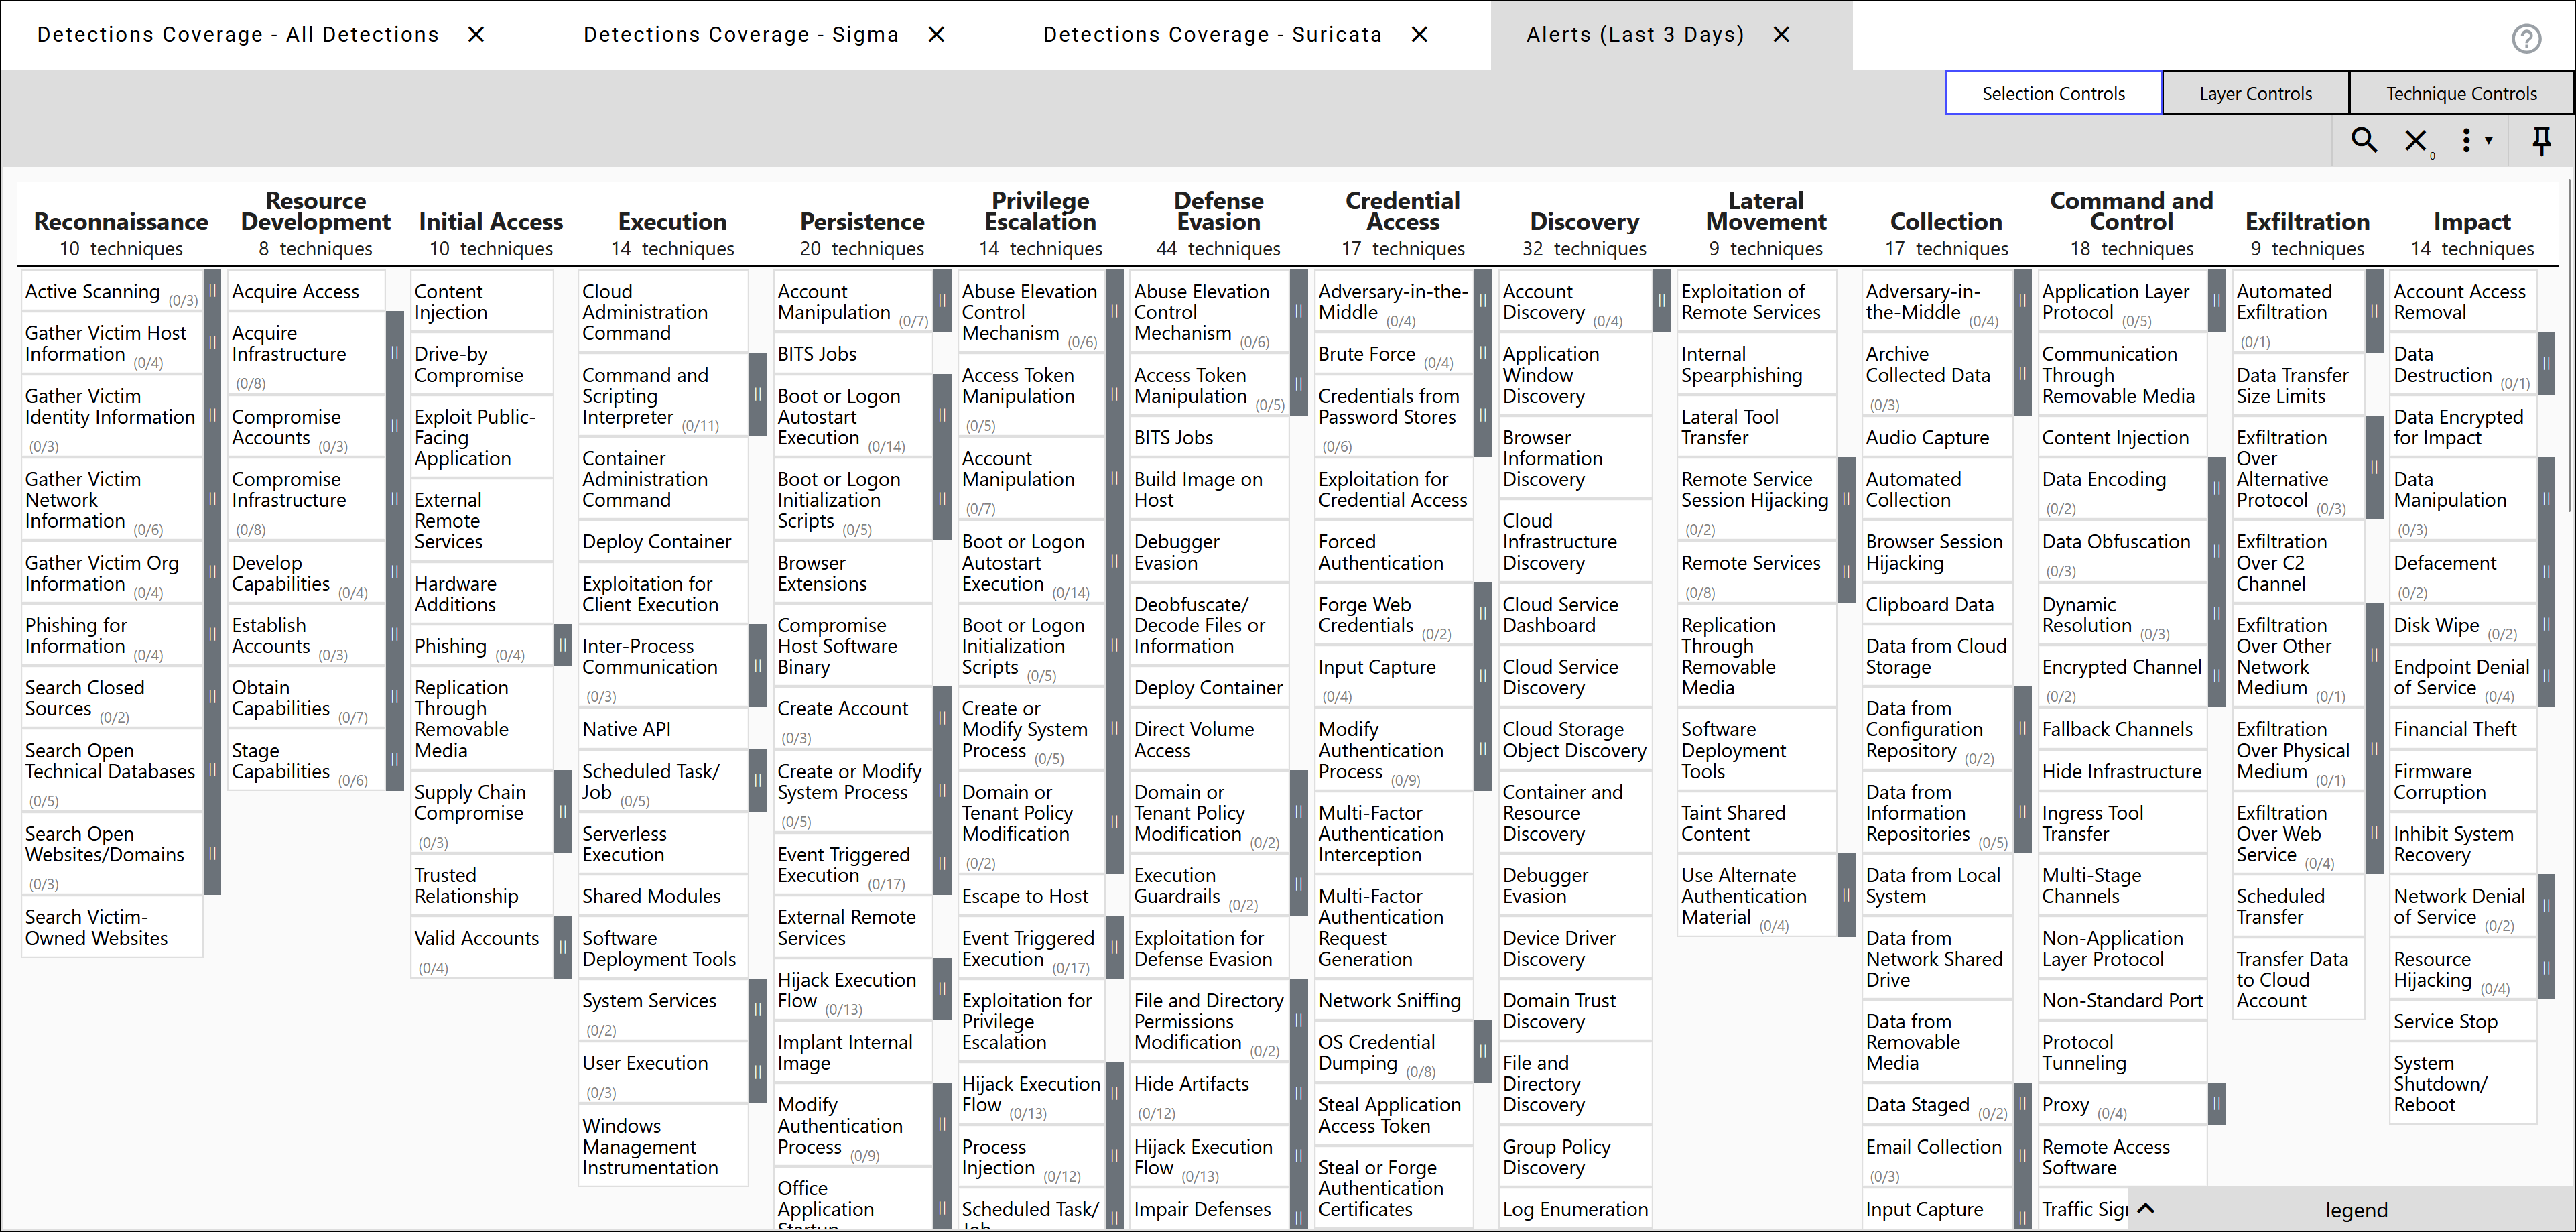
- Navigator provides you with an interactive version of the MITRE ATT&CK Framework that you can use as an information resource when investigating incidents.
- A Kibana instance that provides security information and event management (SIEM) functionality.
- Onion AI: This is a premium feature sold by the creator of Security Onion, Security Onion Solutions.
As you can see, Security Onion has a lot of features, and there are lots of different ways to use them.
First, you need to complete a few more configuration tasks.
Security Onion Configuration: Set Home Networks
As described in Create VMware Private Virtual Networks for the Security Onion Environment, you designed this environment with a simulated local-area network (LAN) called HOME_NET_LAN, with an IP address space of 10.10.10.0/24. Now you need to specify this network as the HOME_NET that Suricata and Zeek are monitoring and defending. You used to declare this network as part of the initial configuration process for Security Onion, but now you can do it through the Security Onion Console.
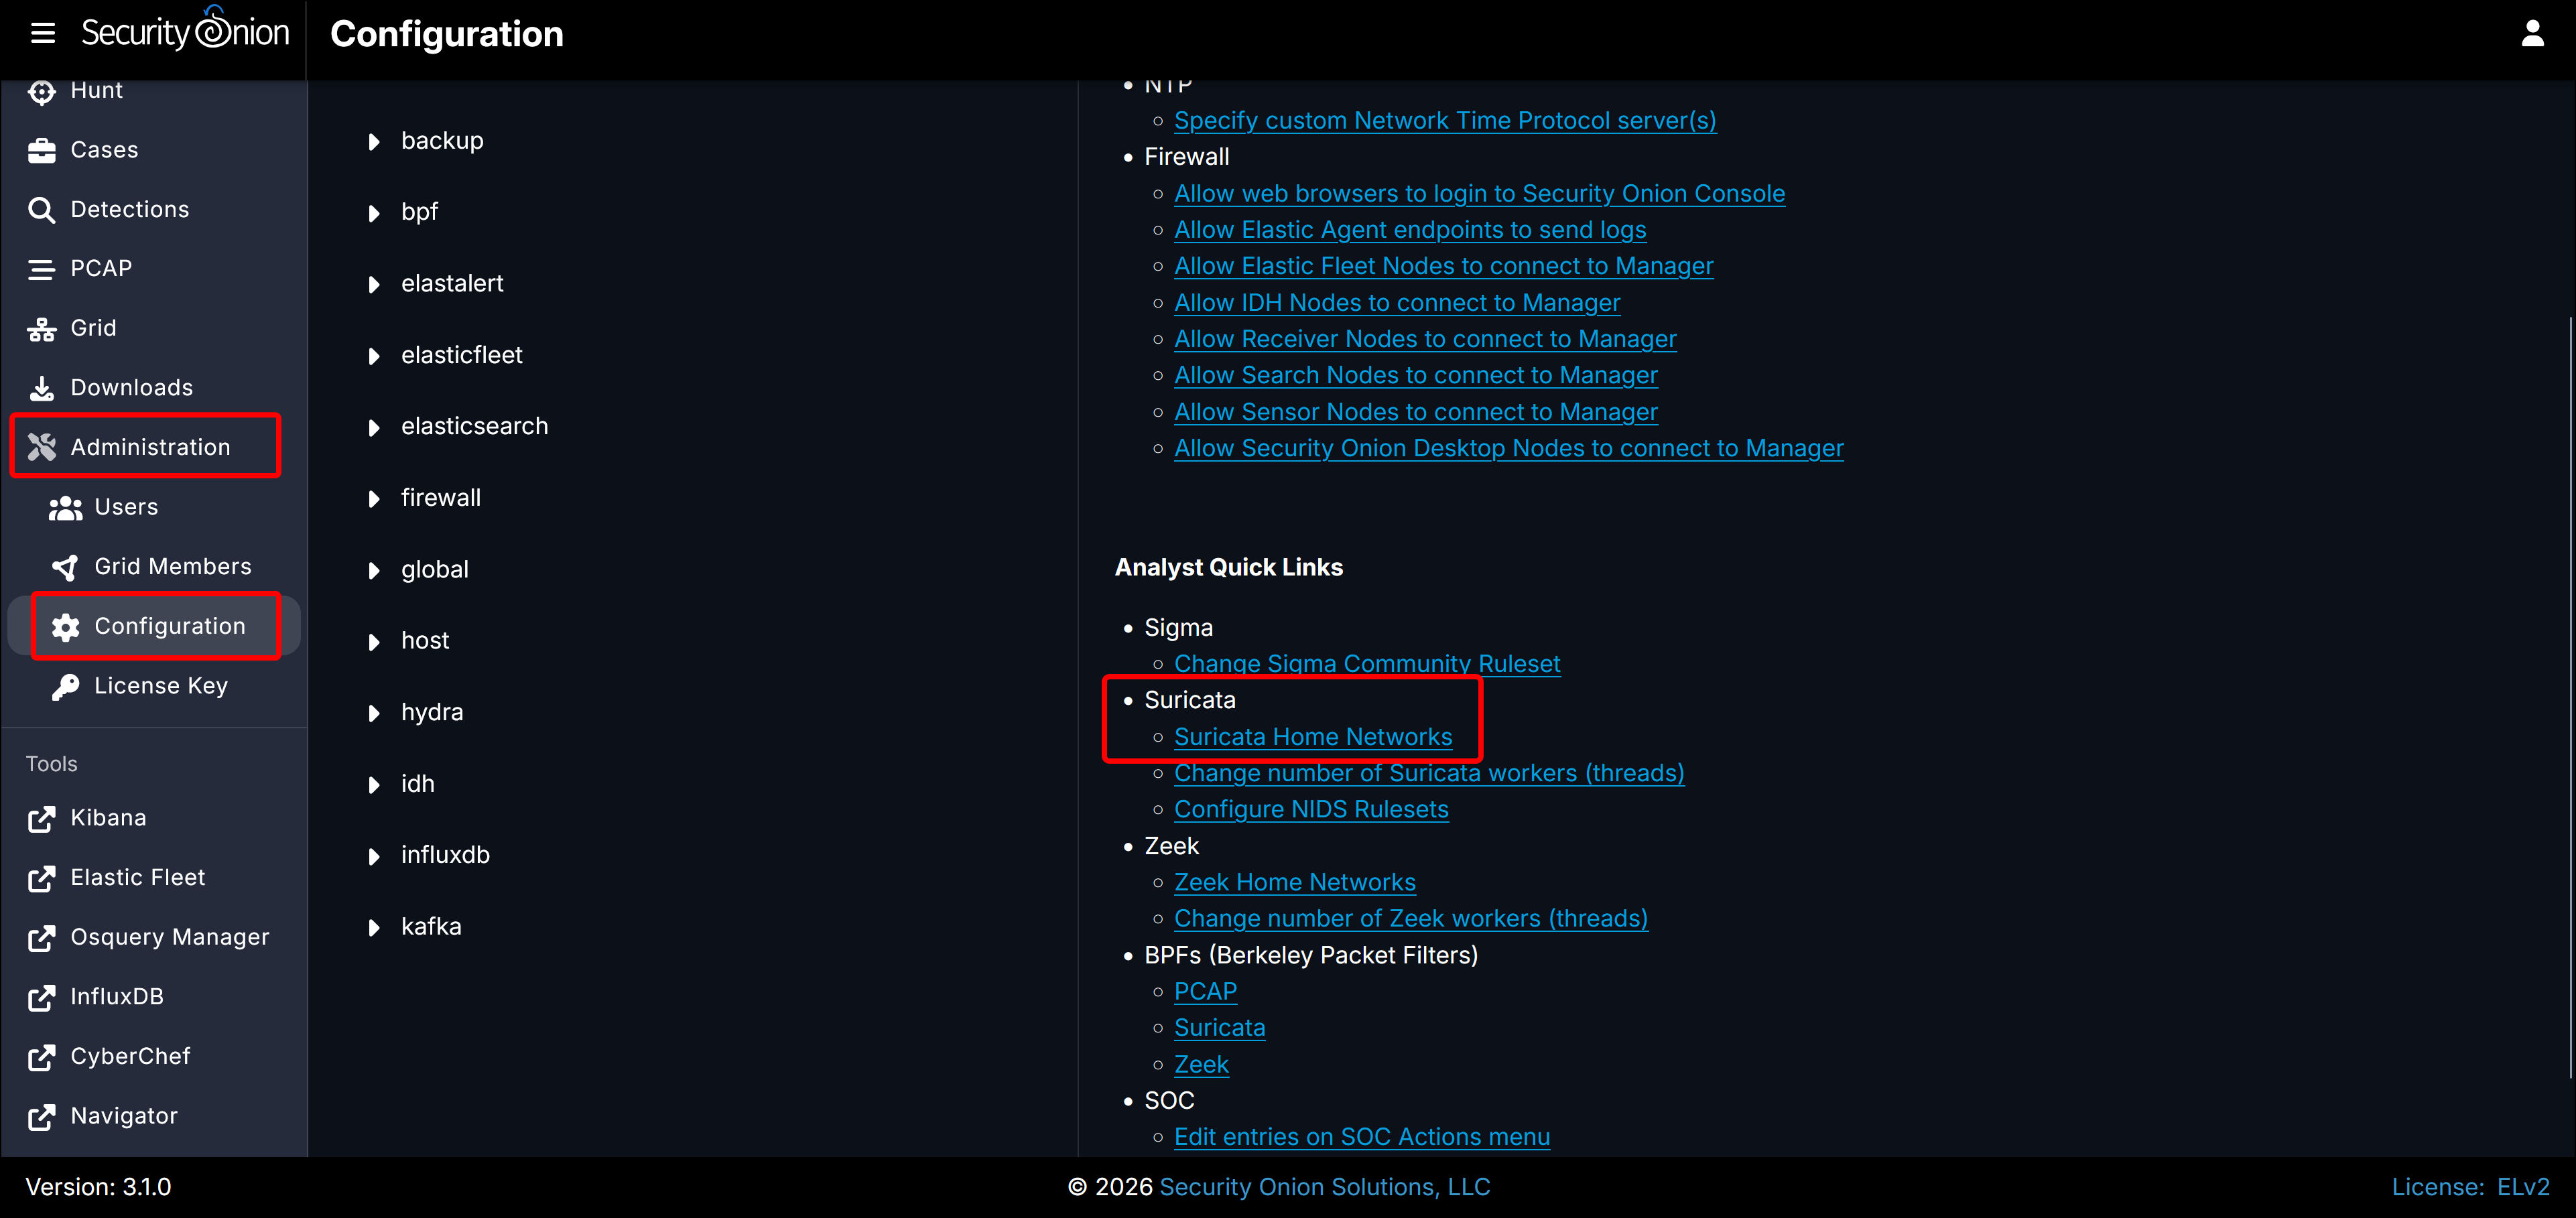
- In the Security Onion Console, click the Administration link in the left sidebar, then click Configuration. Under Analyst Quick Links > Suricata, click Suricata Home Networks.
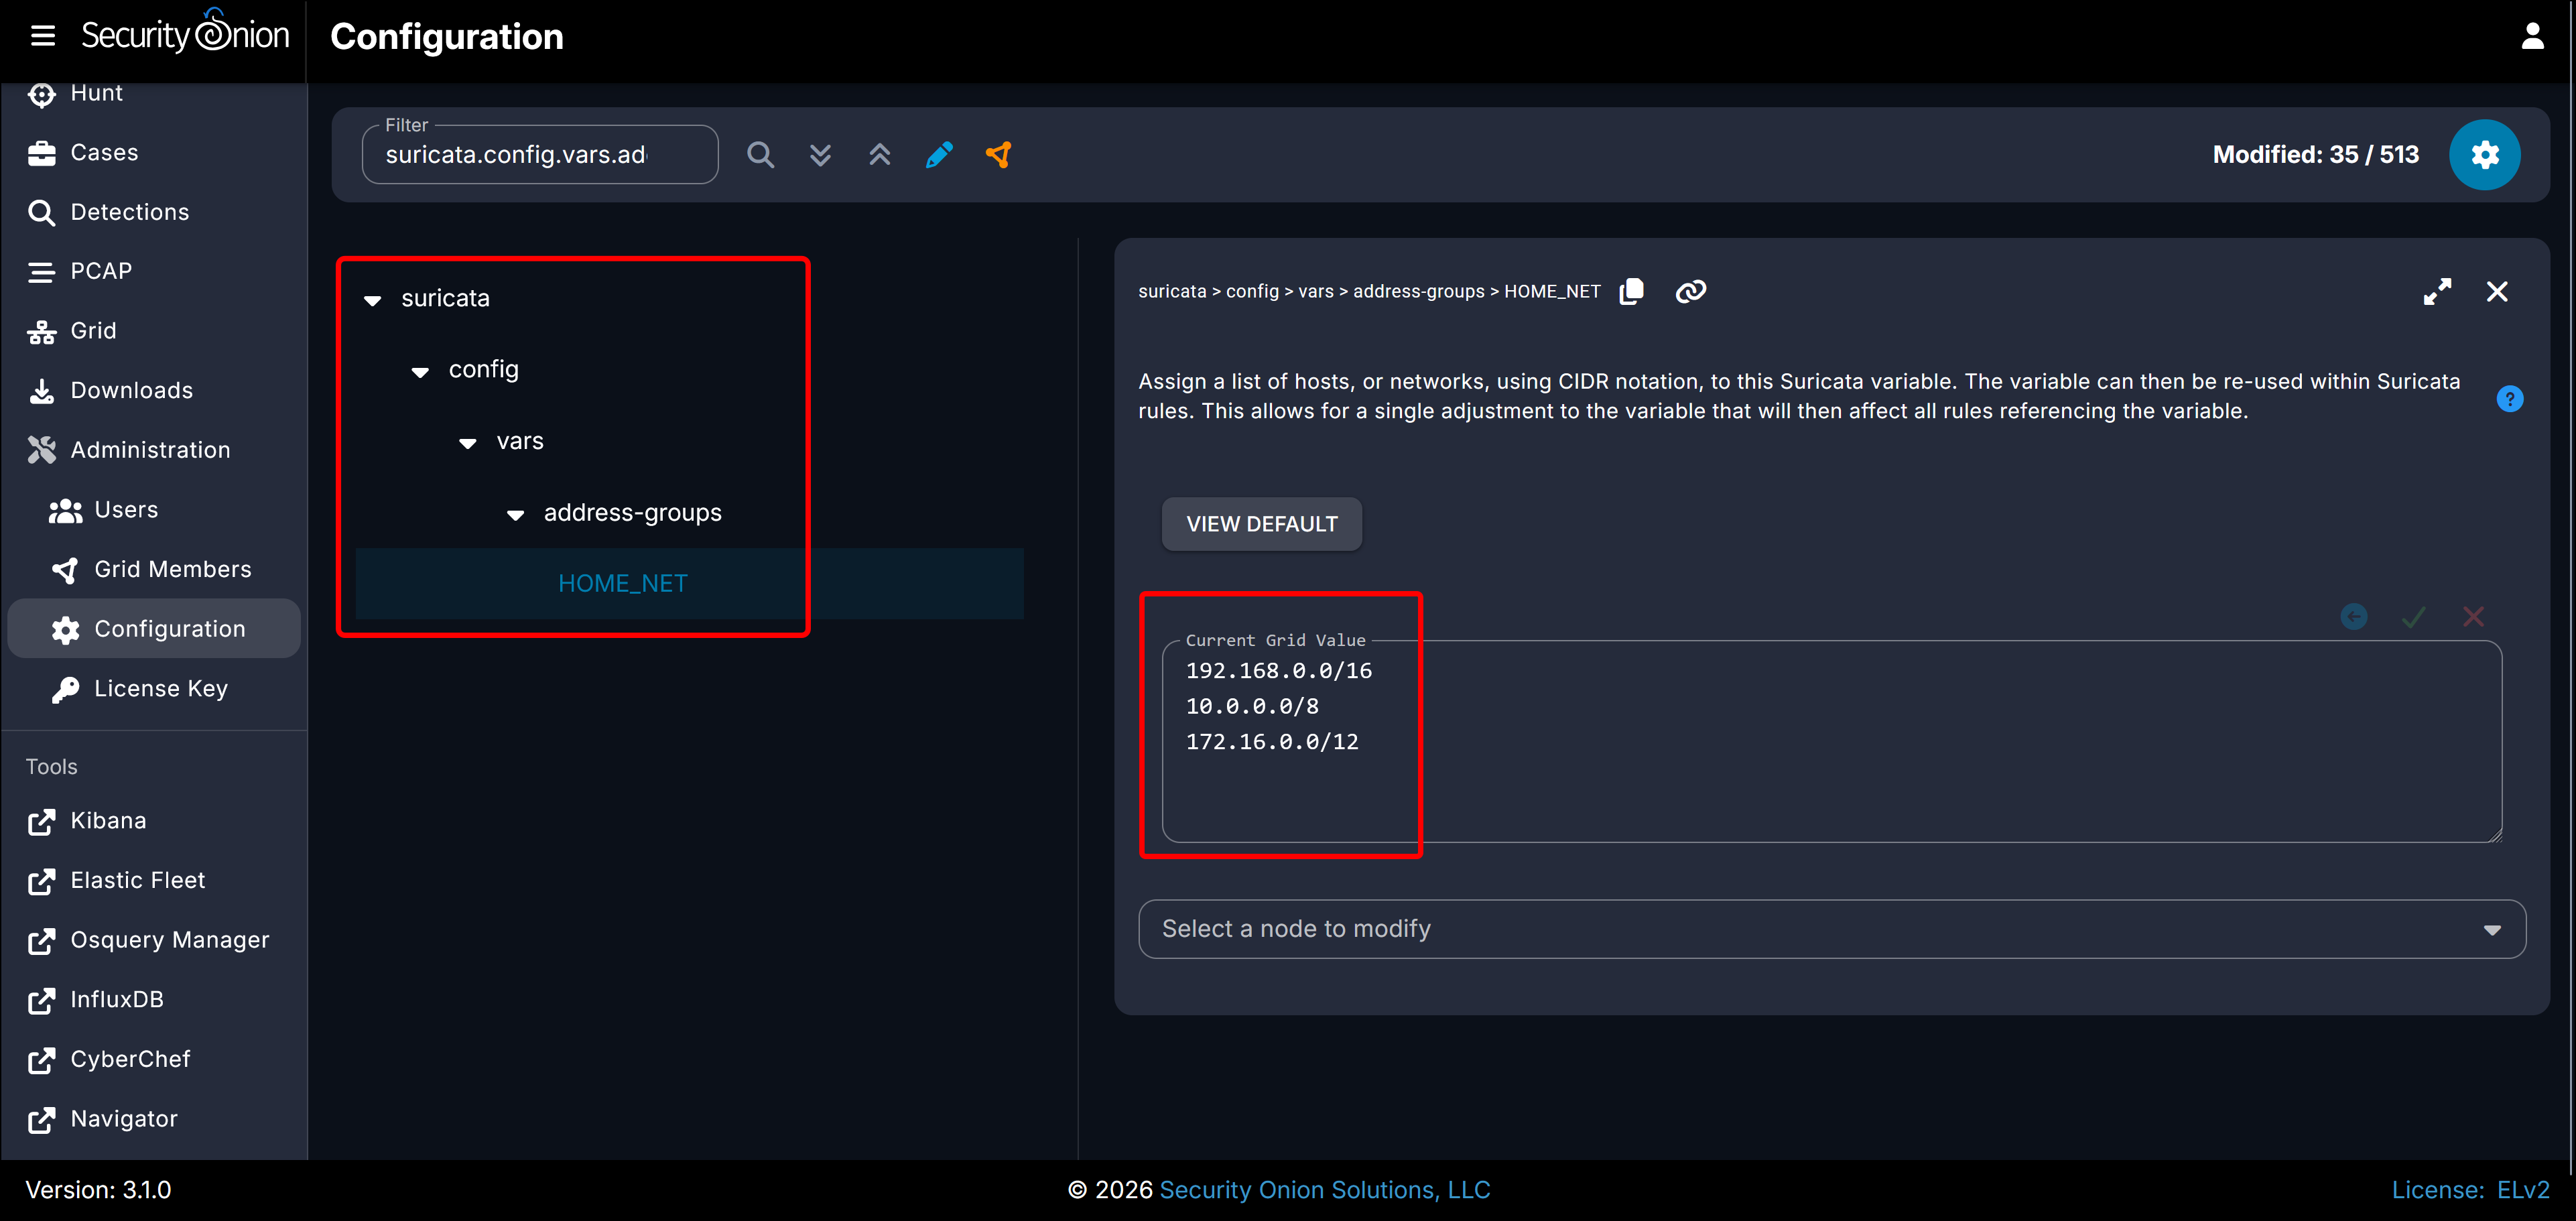
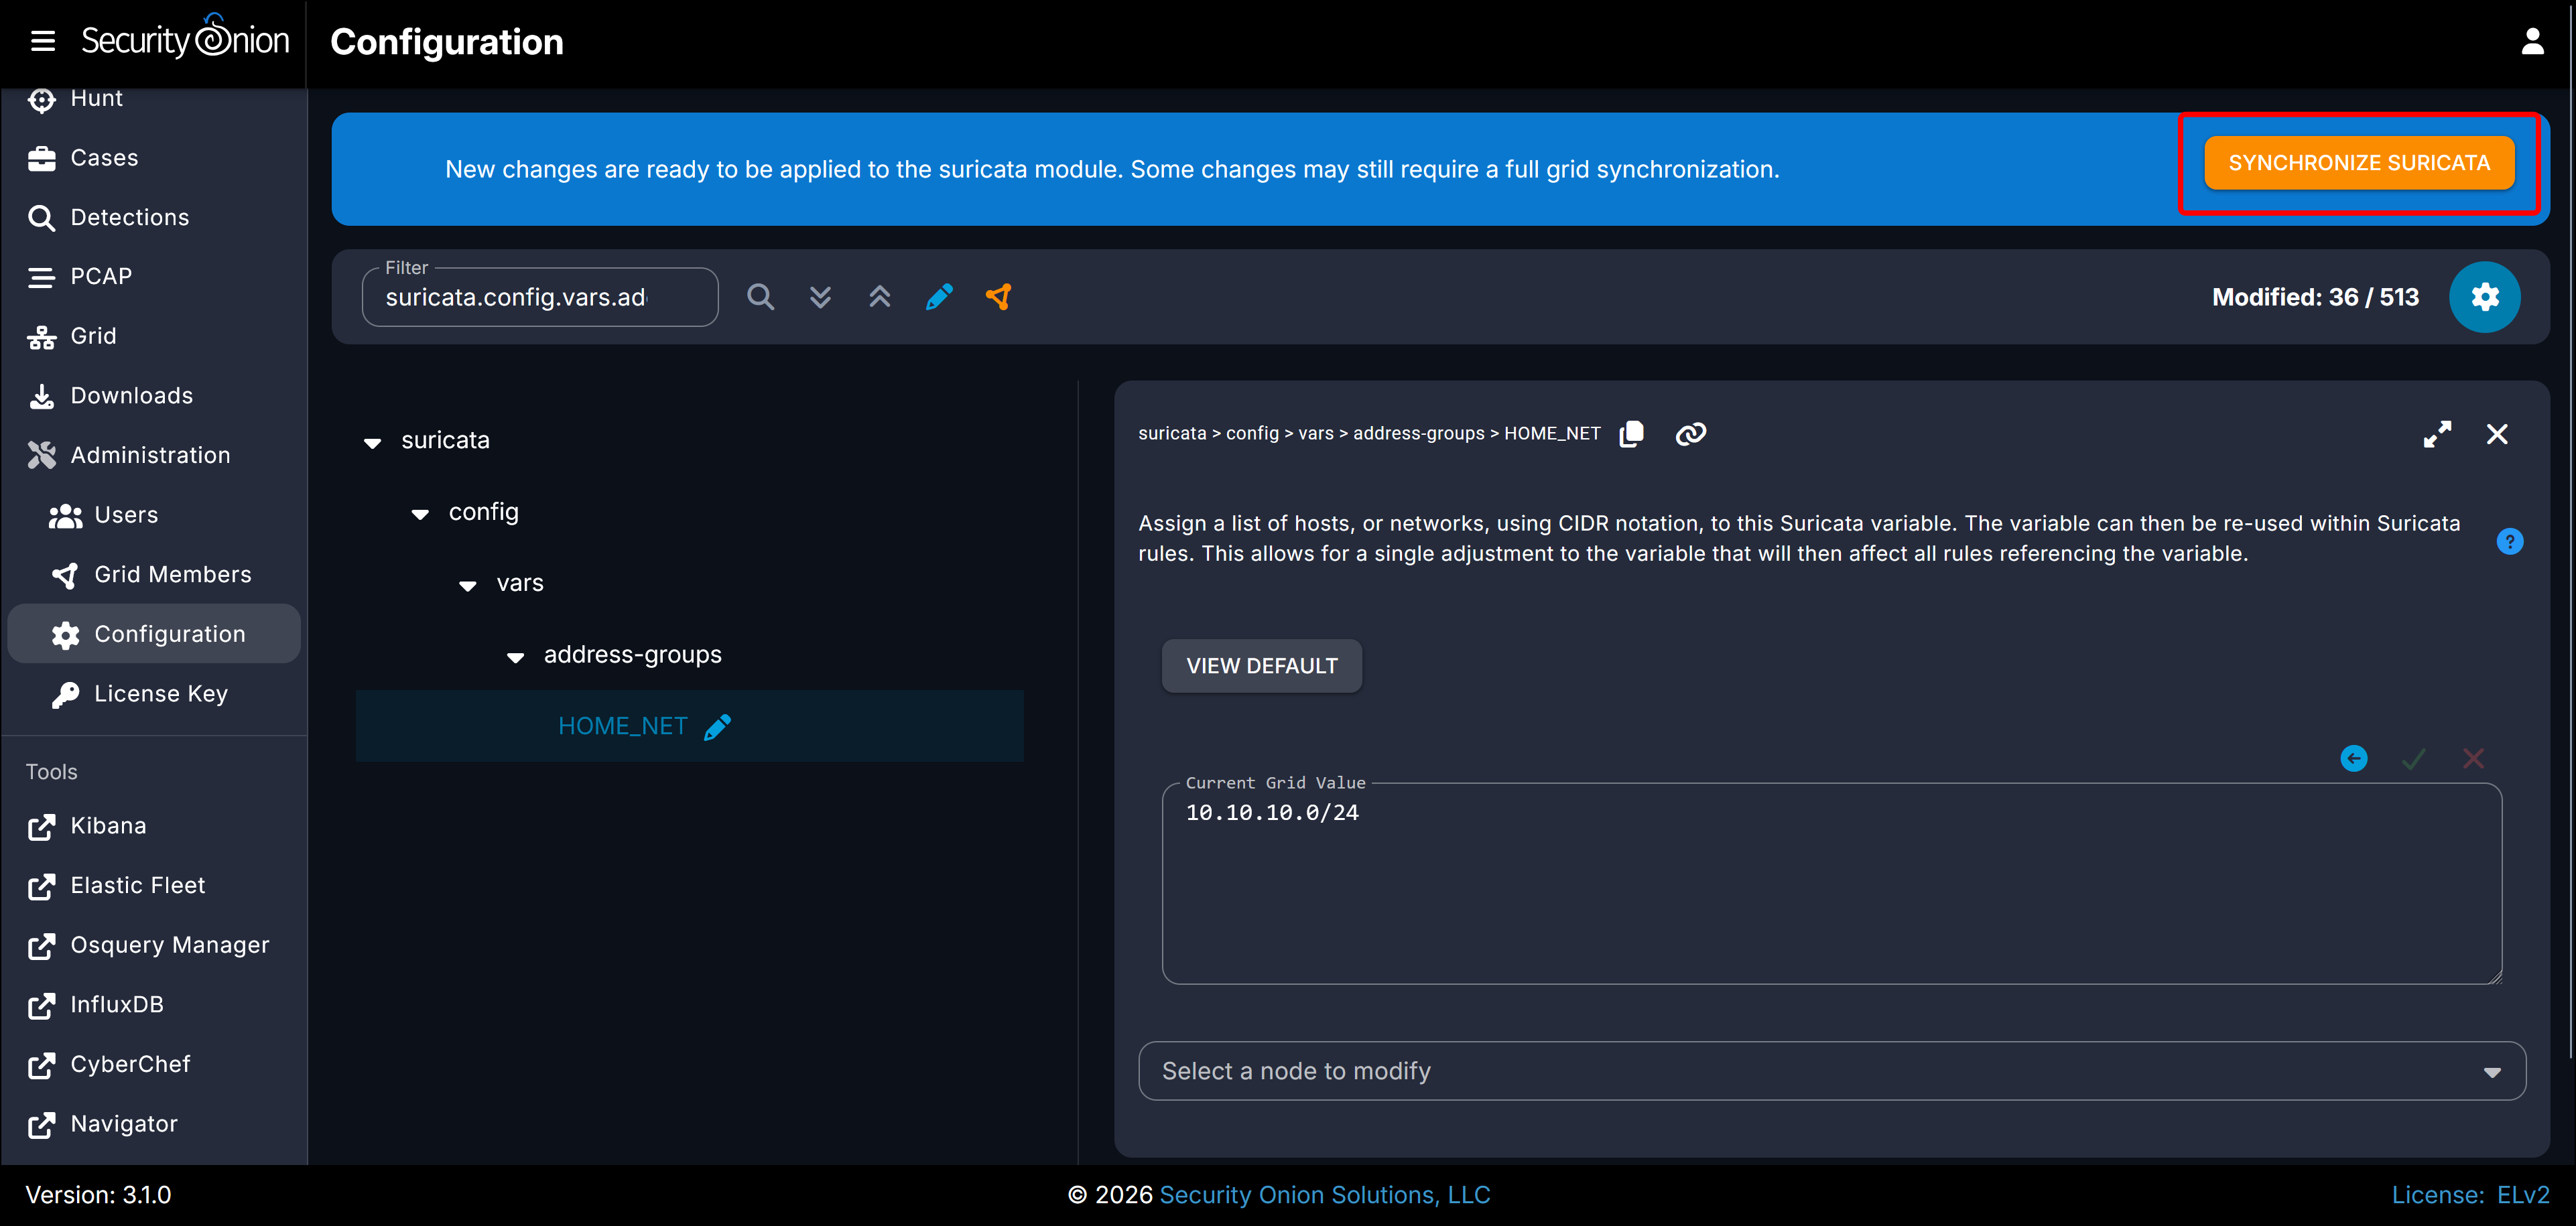
- The HOME_NET variable setting is under suricata > config > vars > address-groups > HOME_NET. By default HOME_NET is set to the RFC 1918 Class A, B, and C private networks.
- We only need Security Onion to monitor a relatively small part of the Class A network, and since we already declared our EXTERNAL_NET_LAN to be a part of that same CIDR block, it is best to specify that. In the Current Grid Value text field, enter 10.10.10.0/24.
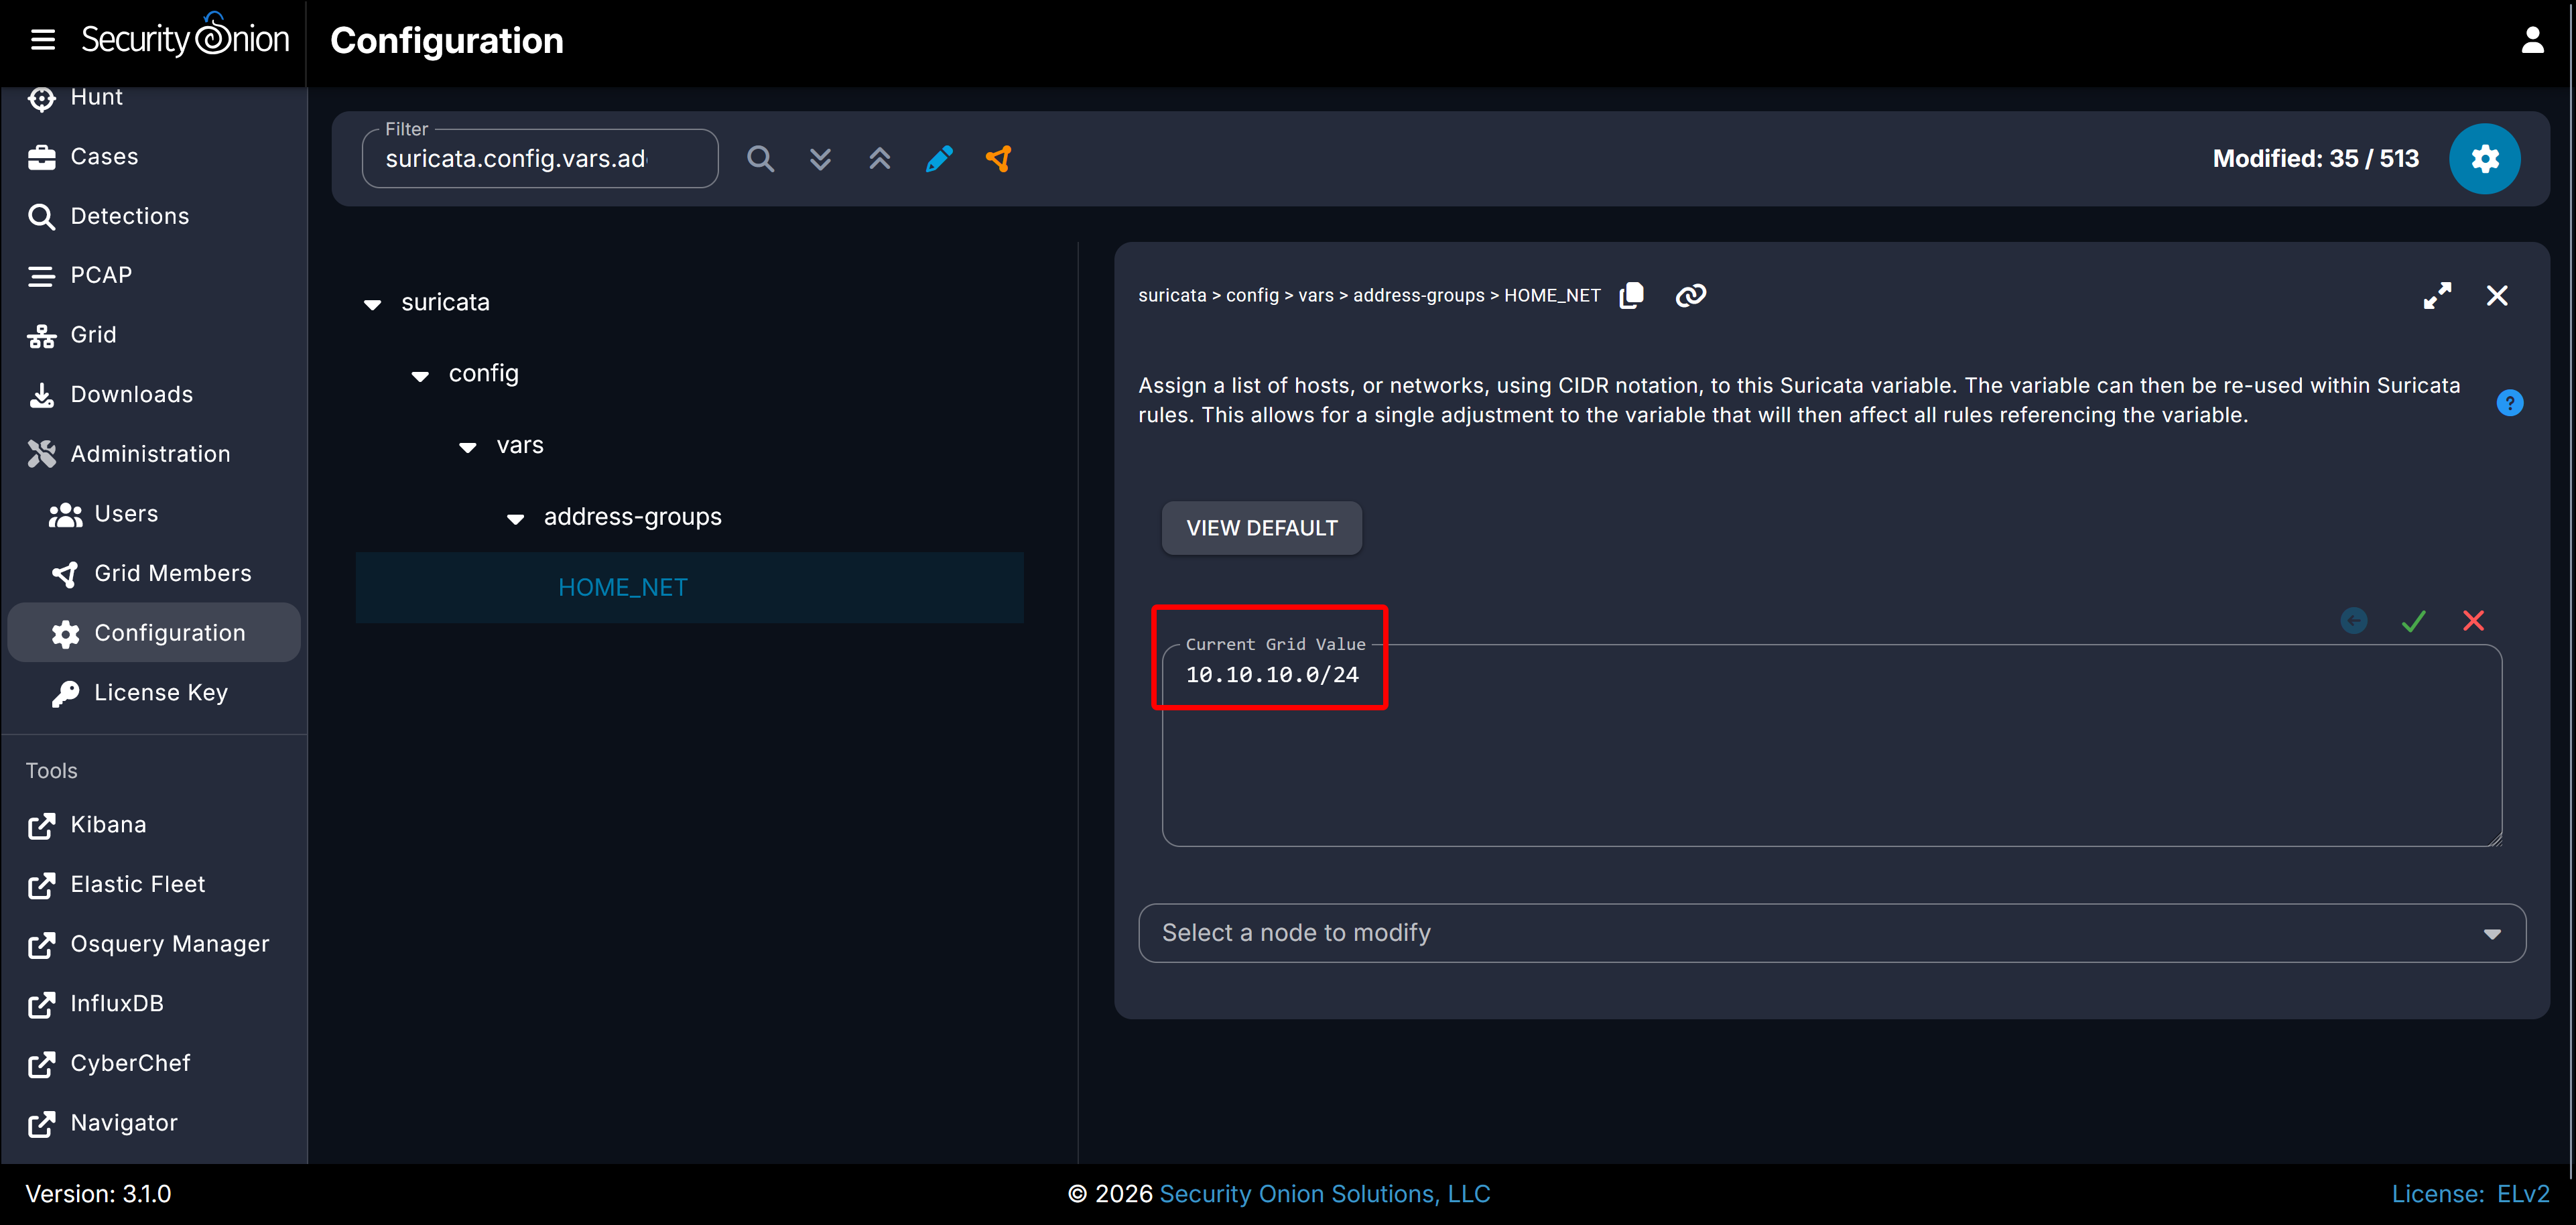
- You can click the ** ** drop-down menu, but you will see there is only one option, onion2026 (standalone) and clicking on it won’t do anything.

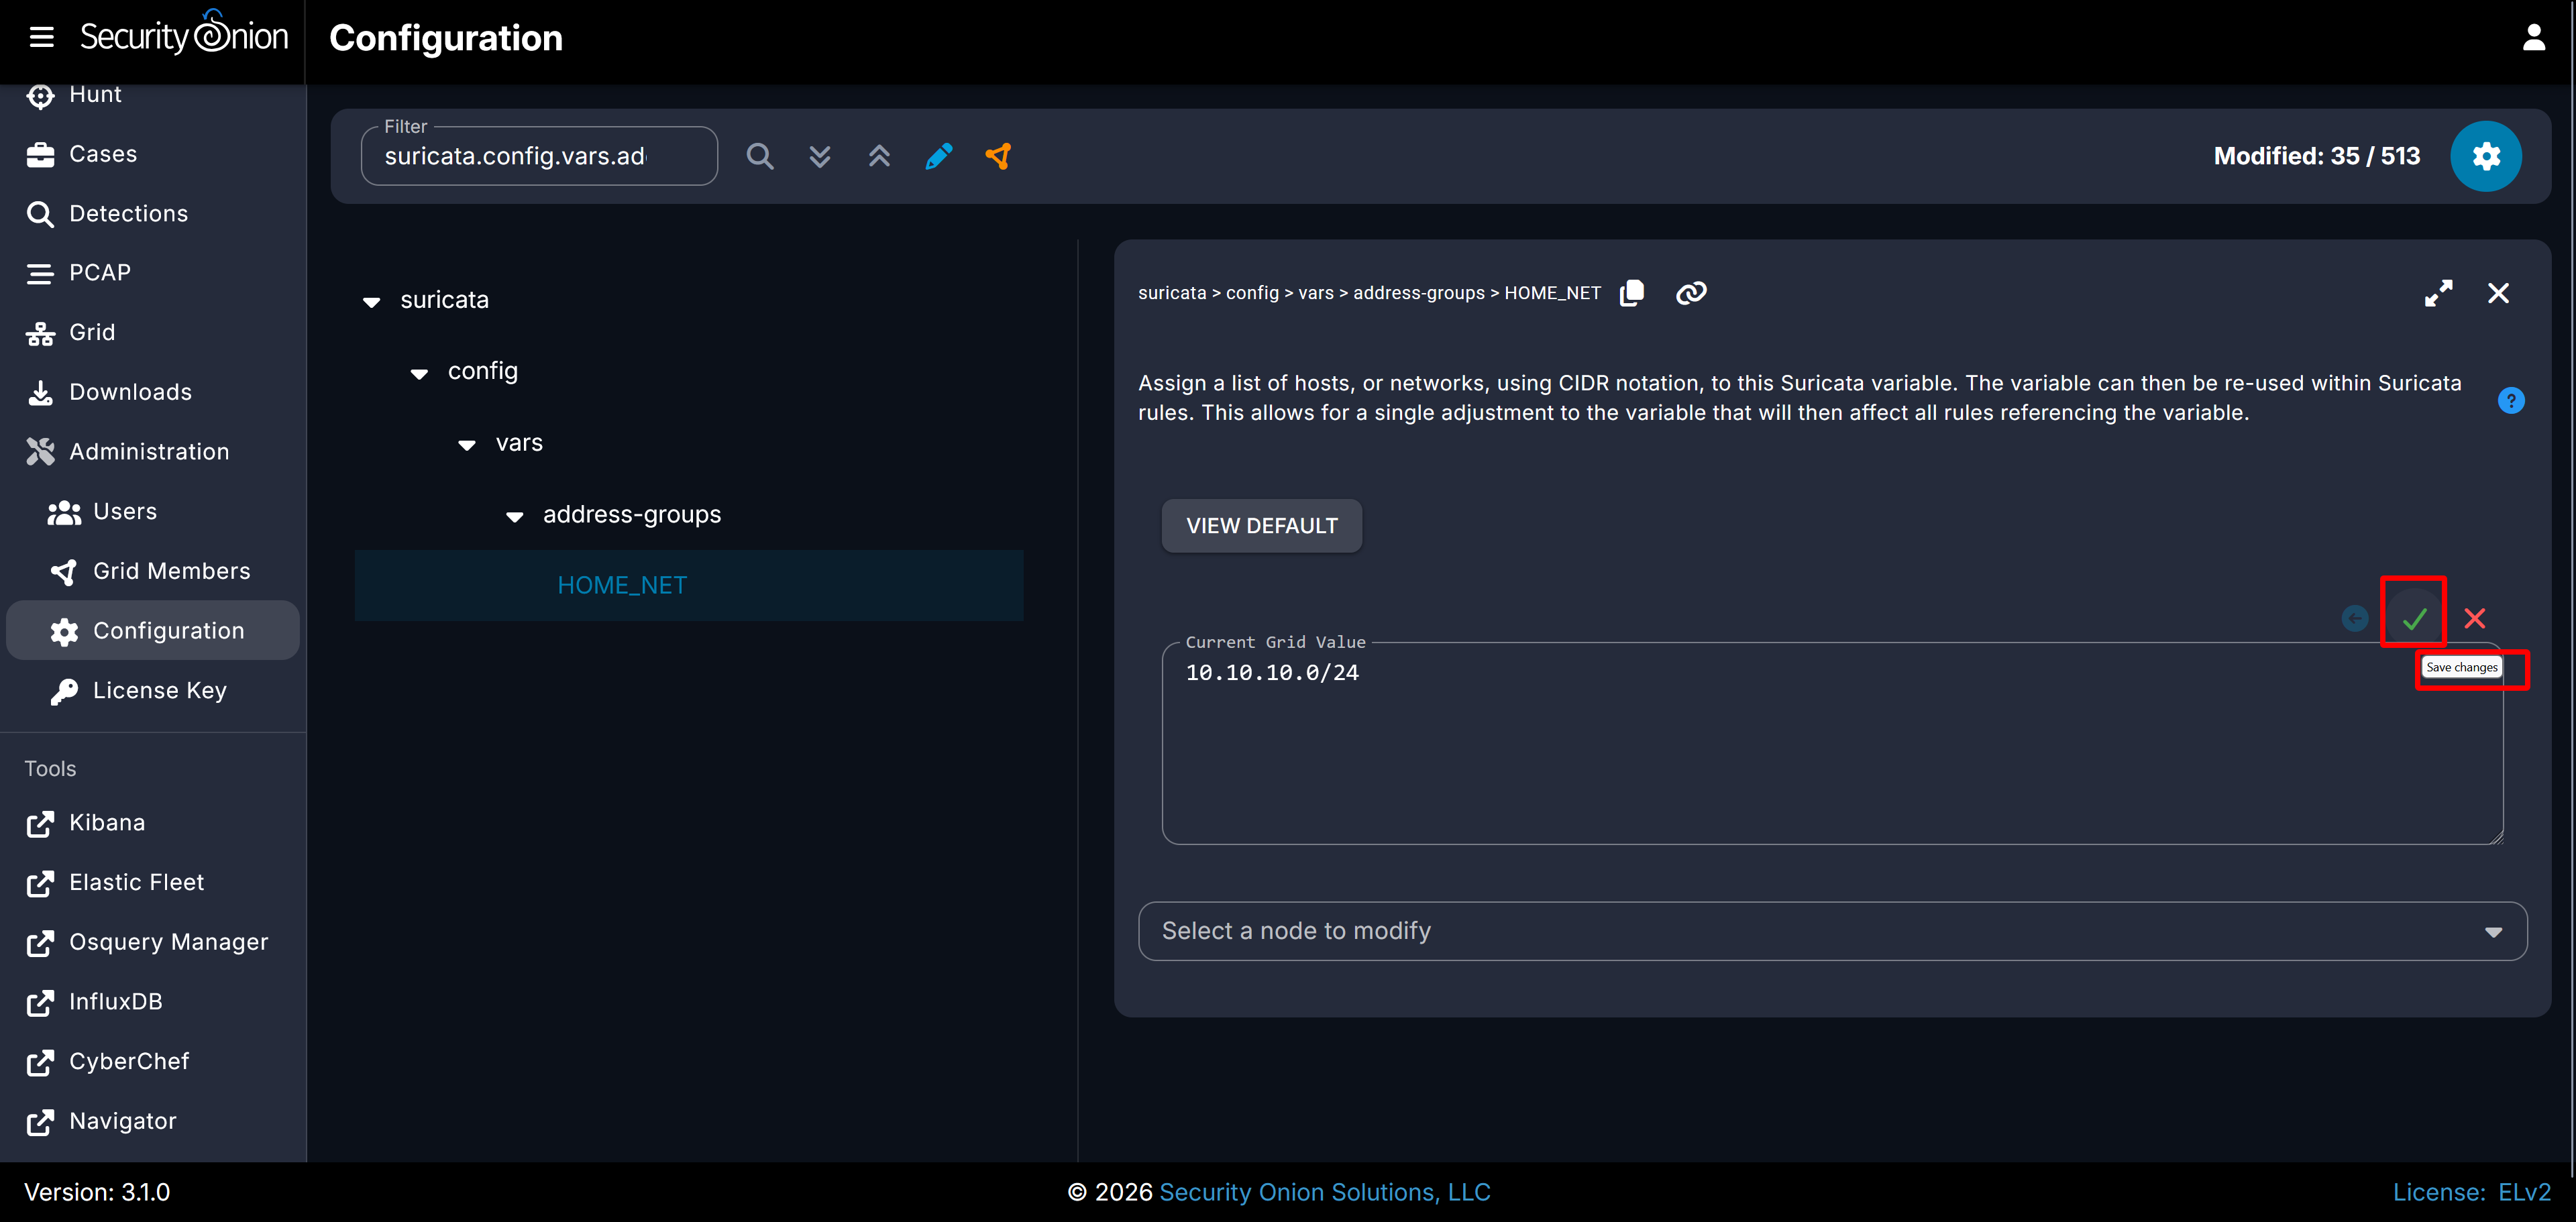
- Hold the pointer over the green check mark and you will see Save changes tooltip text. Click the green check mark.
- A blue banner will display across the top of the Configuration pane stating that New changes are ready to be applied to the suricata module…. Click Synchronize Suricata.
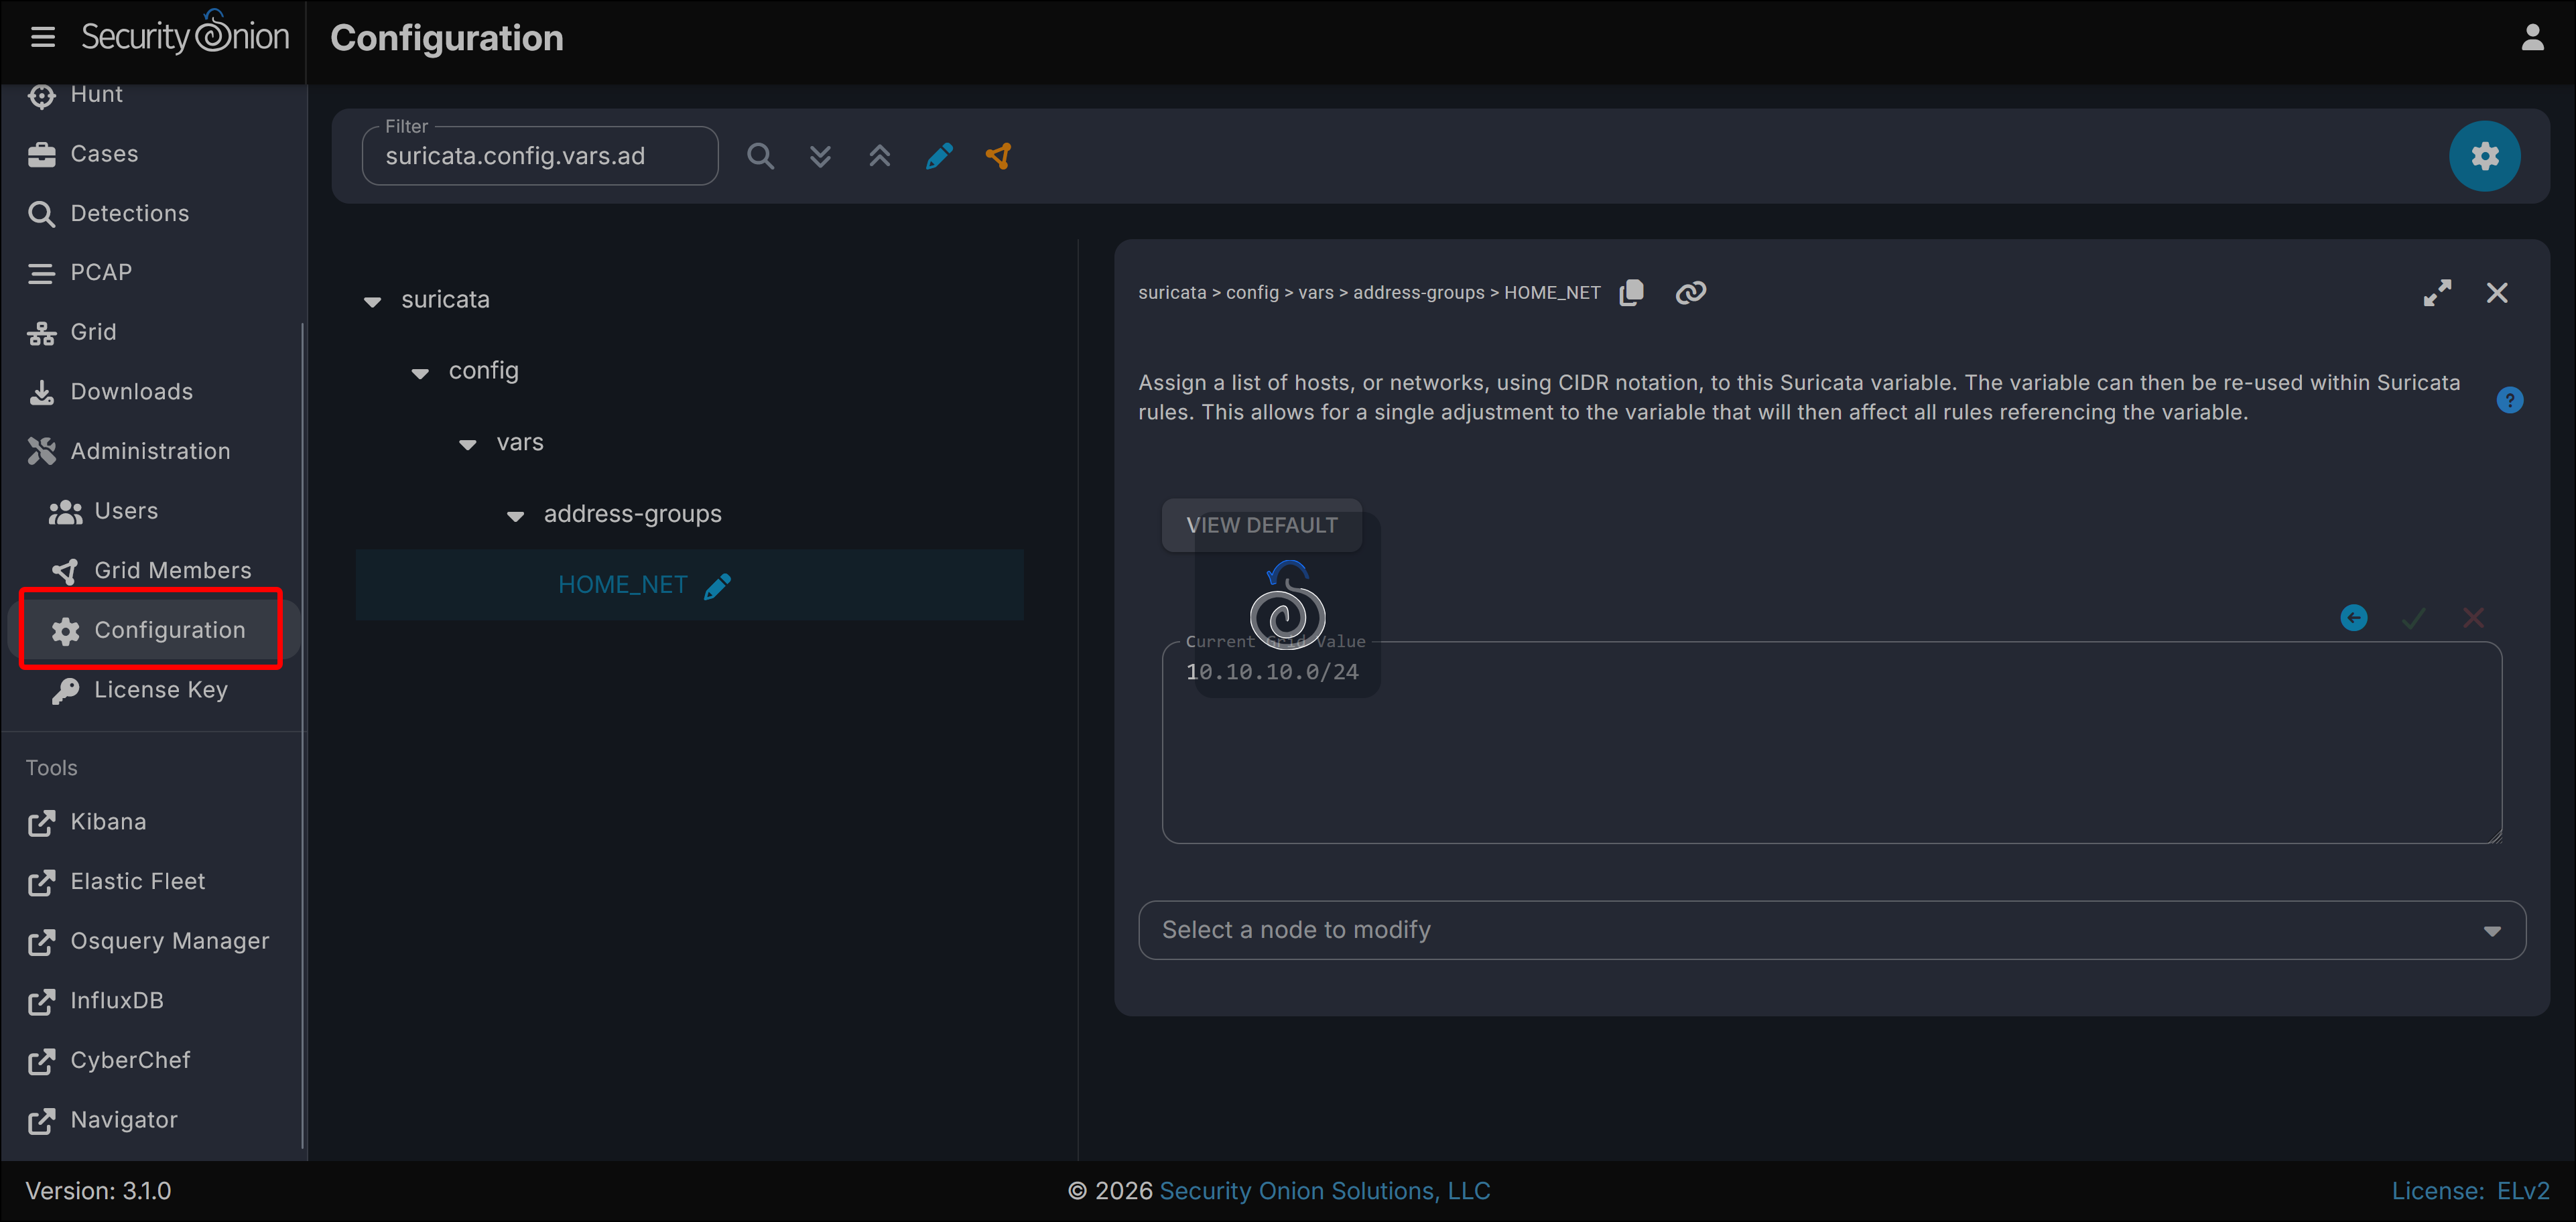
- As the changes synchronize, a Security Onion icon progress indicator displays in the center of the screen. Click Configuration.
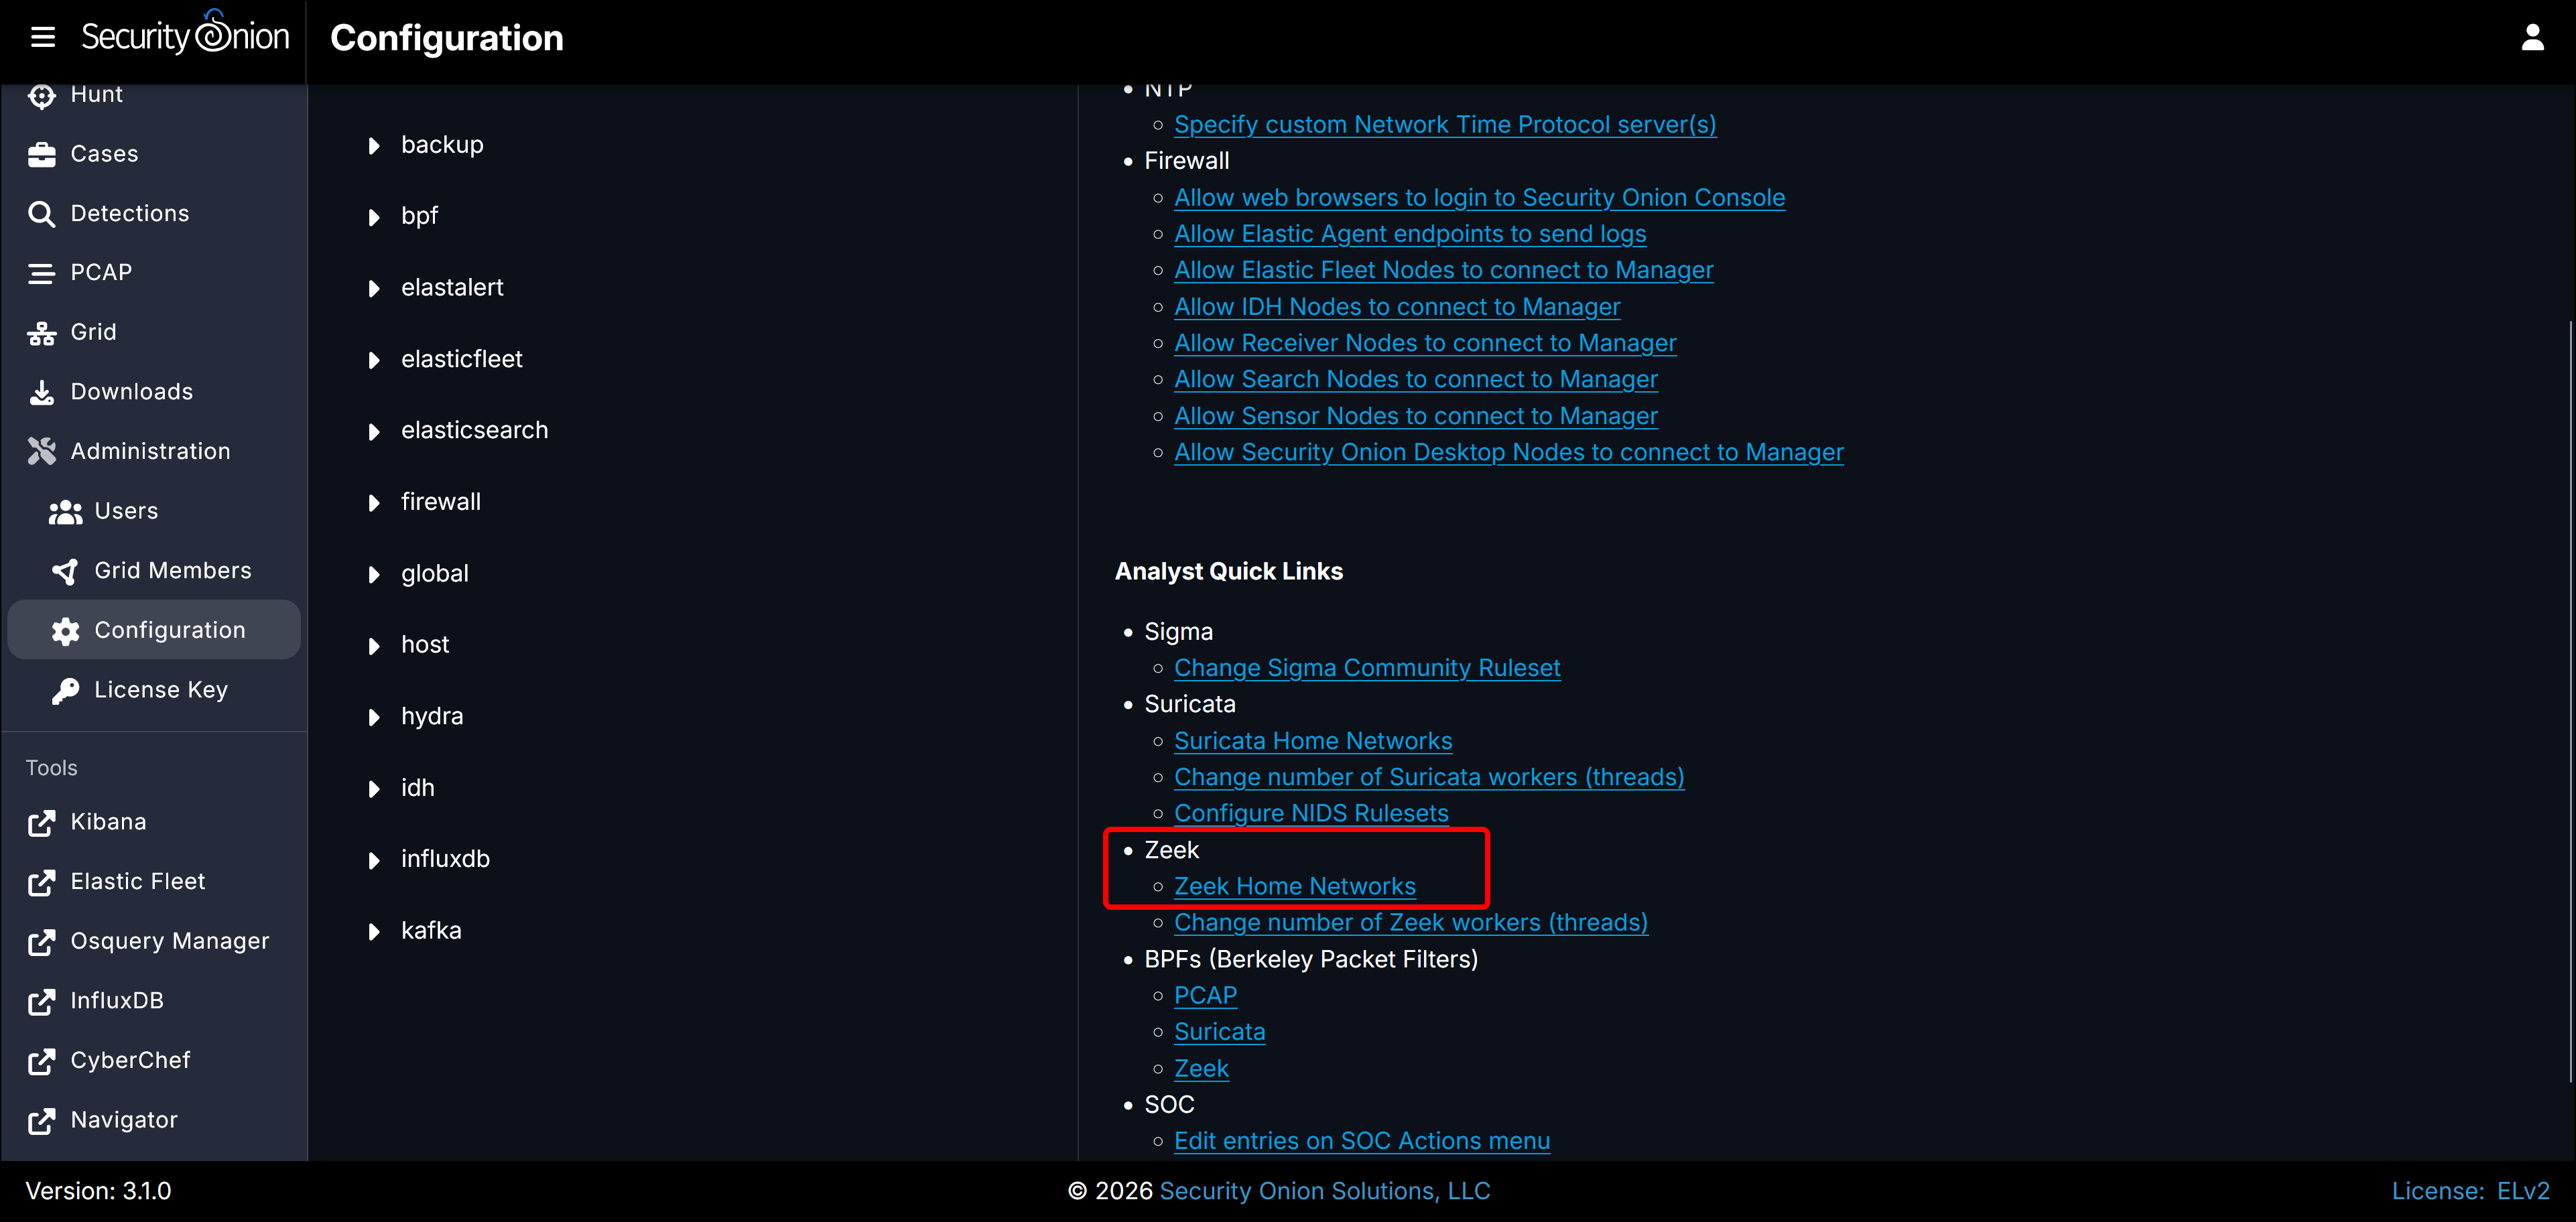
- Under Analyst Quick Links, click Zeek Home Networks under Zeek.
- The HOME_NET variable setting is under zeek > config > networks > HOME_NET. Just like Suricata, HOME_NET is set to the RFC 1918 networks.
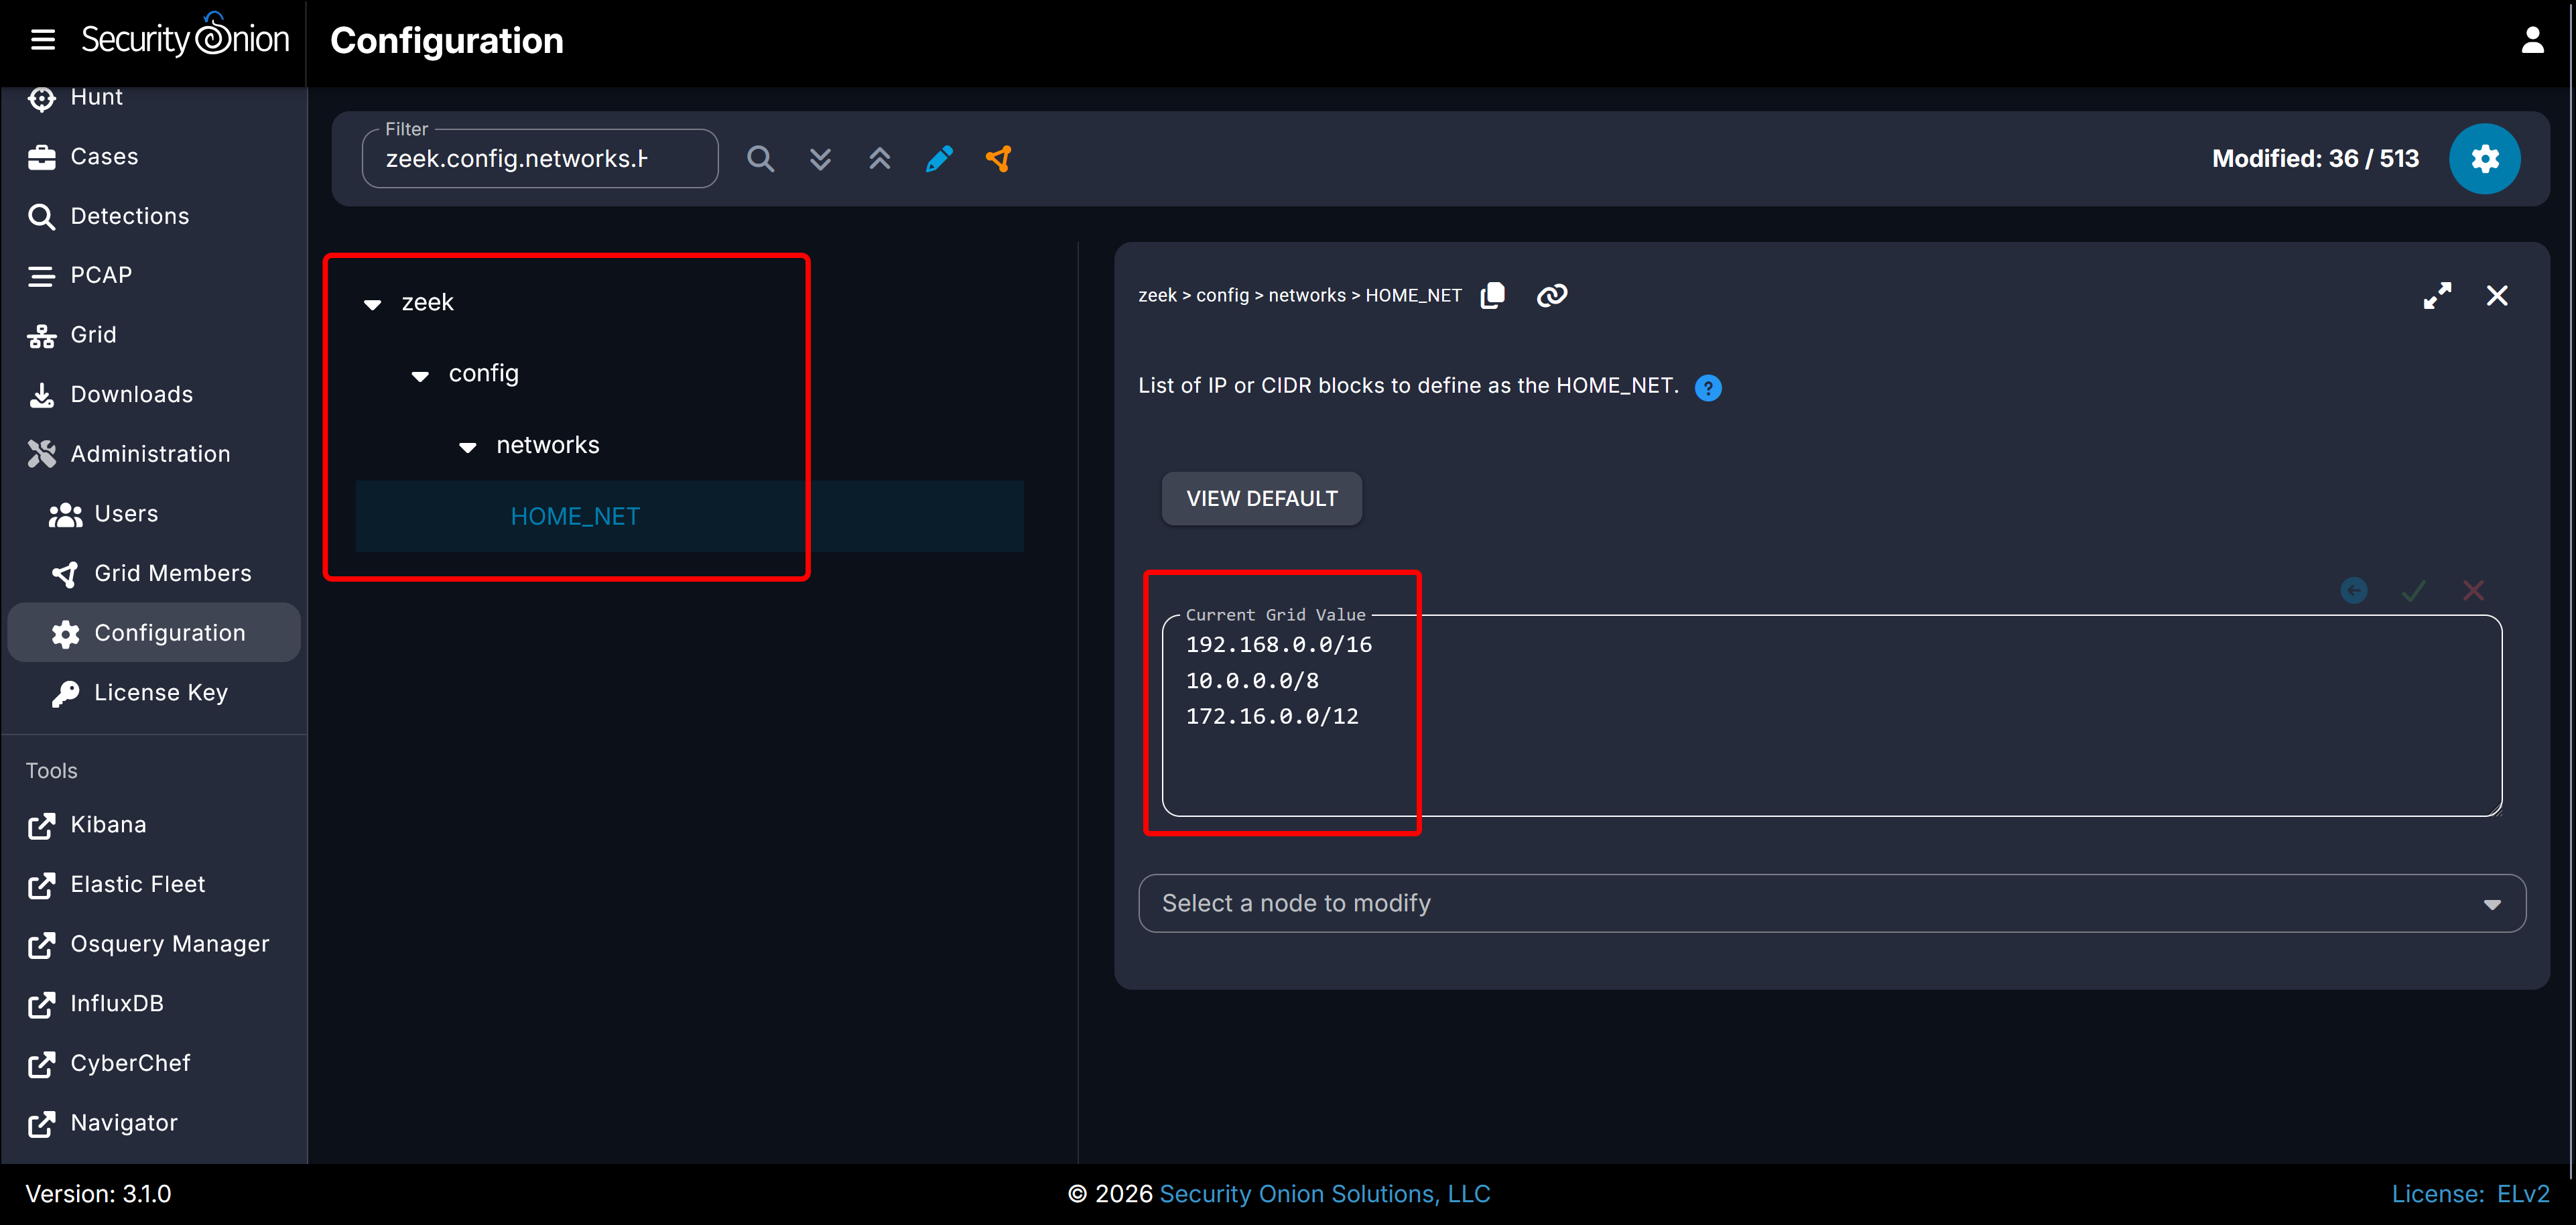
- In the Current Grid Value text field, enter the same value that you set for the Suricata HOME_NET, 10.10.10.0/24 and click the check mark icon to save changes.
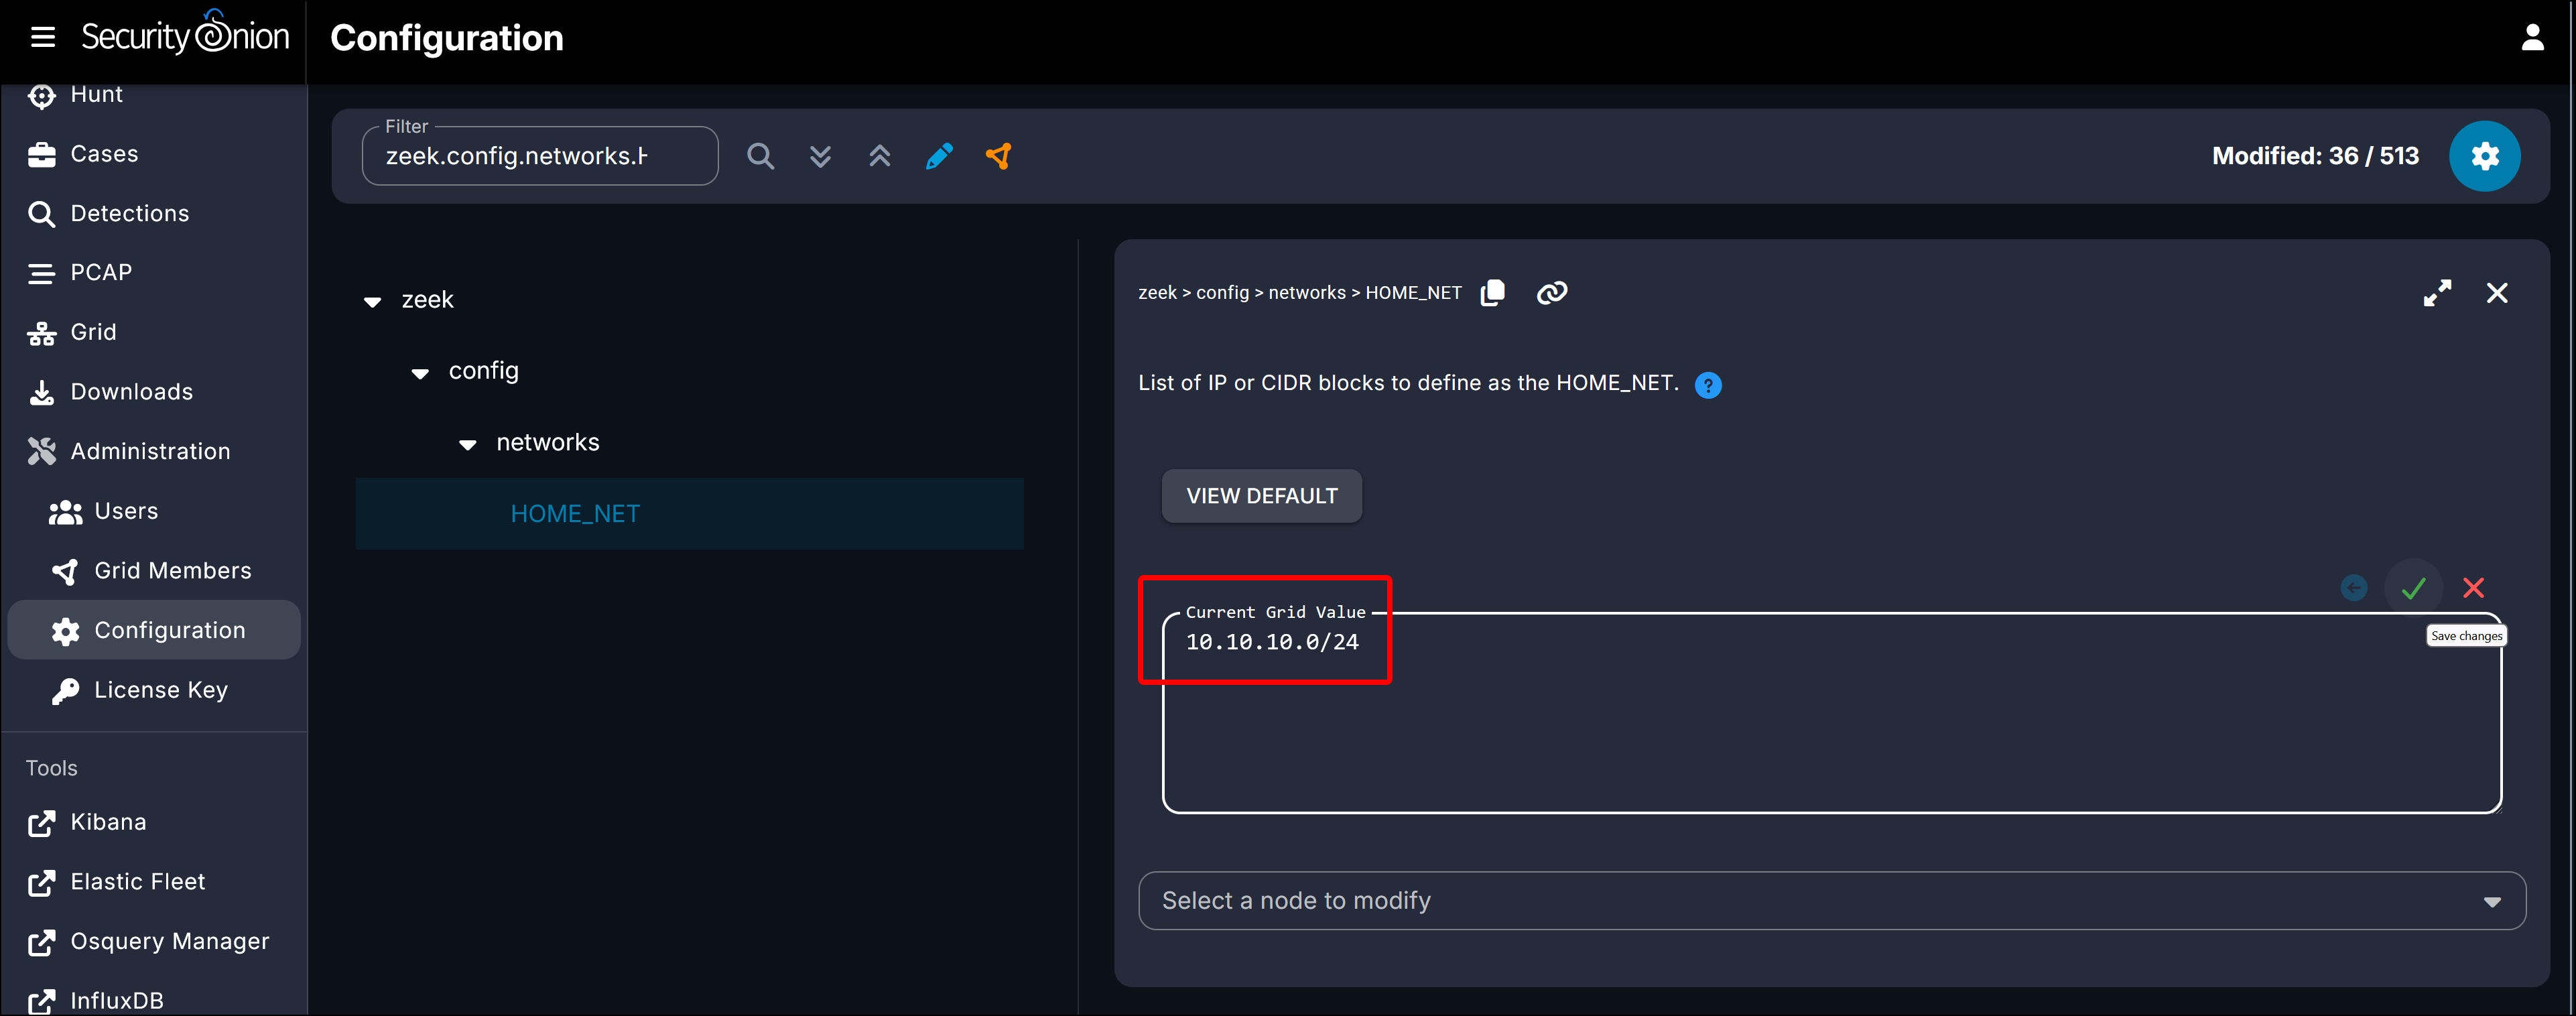
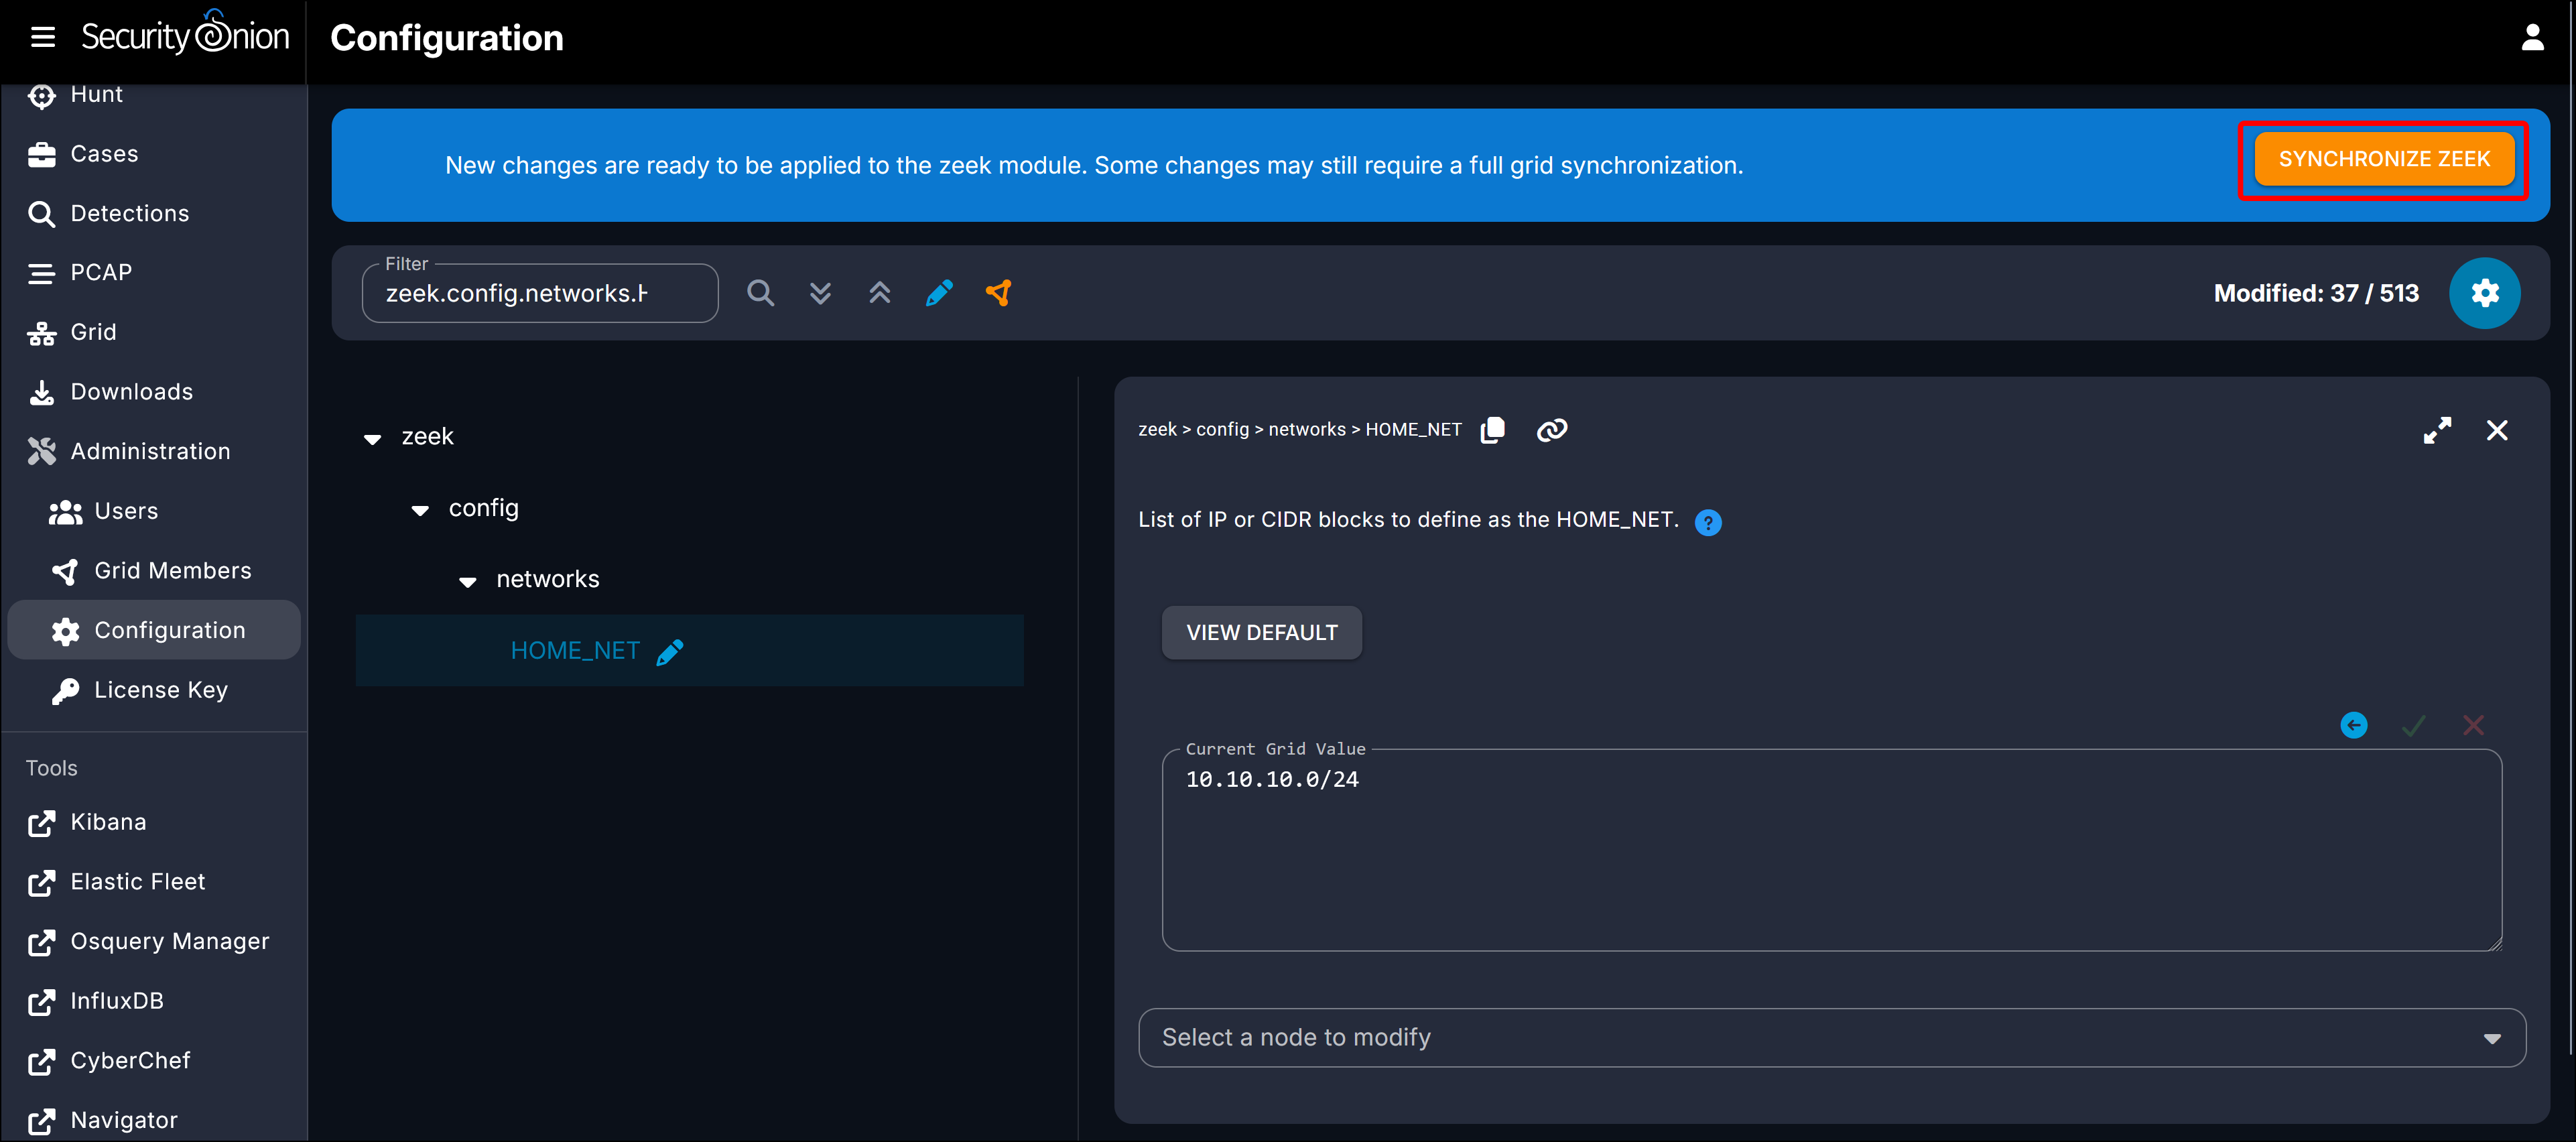
- A blue banner will display across the top of the Configuration pane stating that New changes are ready to be applied to the zeek module…. Click Synchronize Zeek.
Test Security Onion Detections
When you first start using your Security Onion deployment, there will be little or no event data. What exists might be for the VM’s operating system. When I created this page, Security Onion’s Alert page had no events. 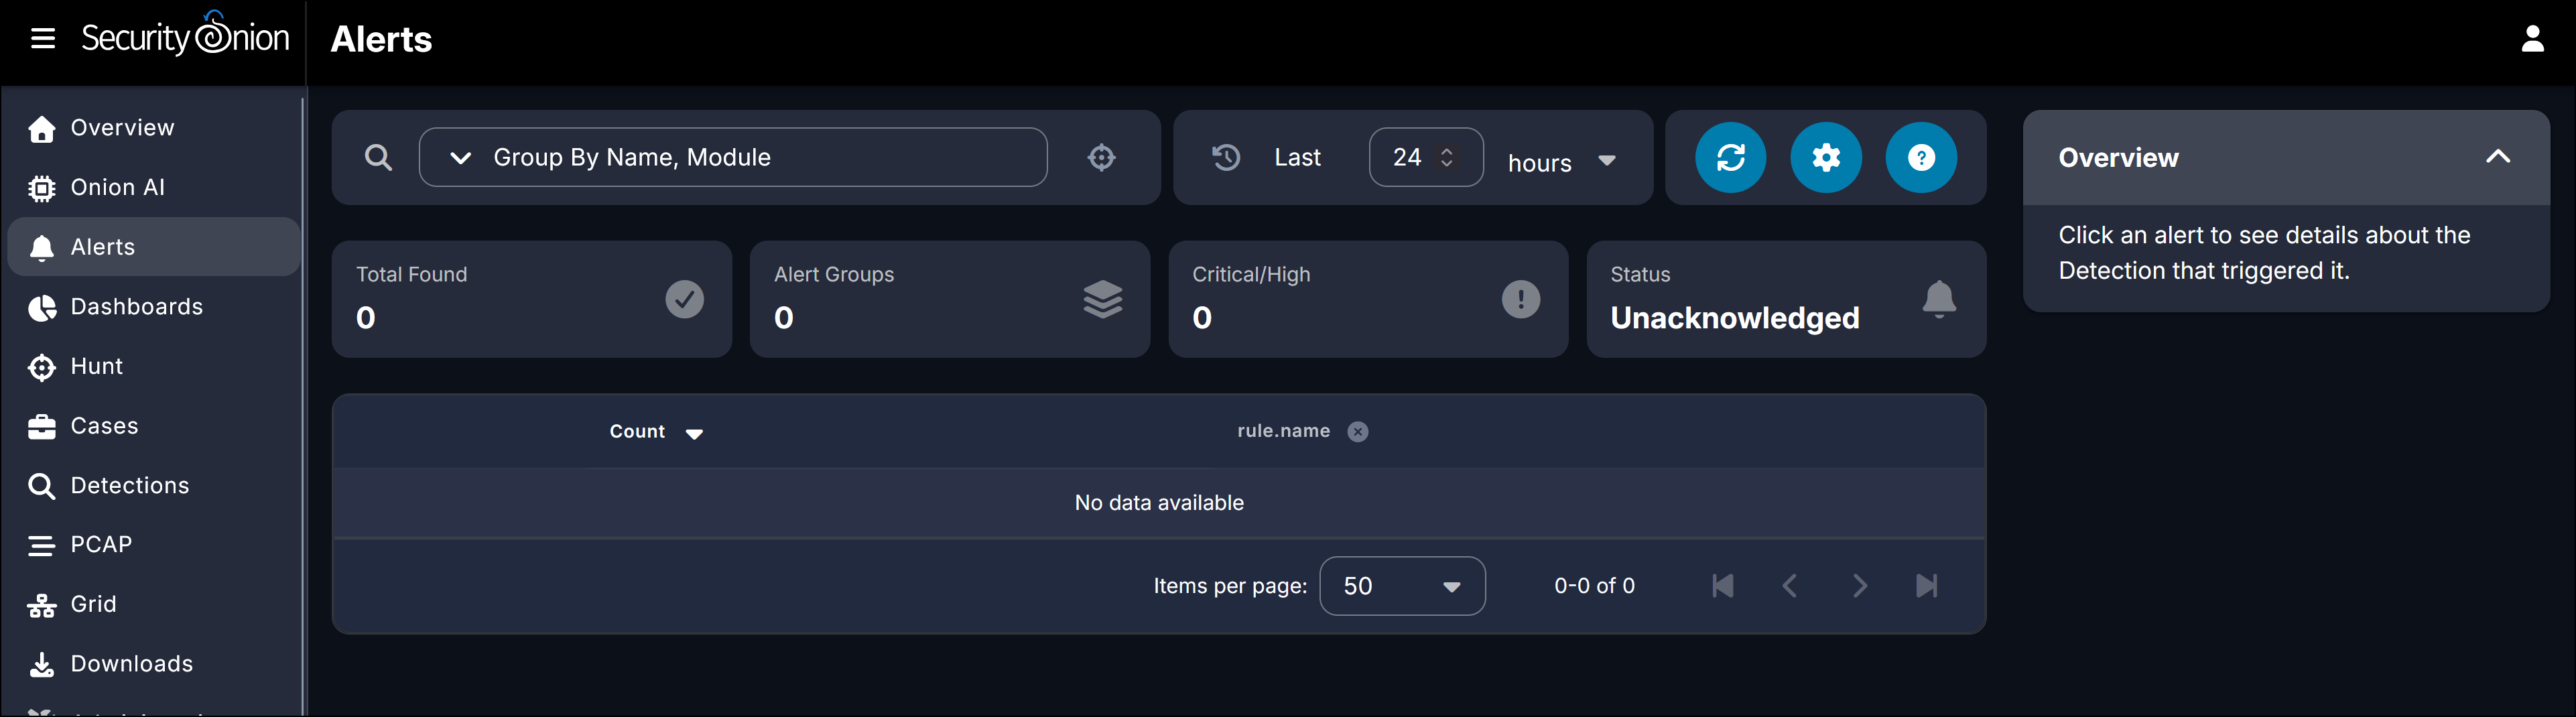
Security Onion provides a test function that you can run from the command line.. Run the command so-test from the command line of the Security Onion VM. This creates a tcpreplay container that simulates traffic in the environment.
-
Run the command
so-testfrom the command line of the Security Onion VM.[onion@onion2026 ~]$ sudo so-test Replay functionality not enabled; attempting to enable now (may require Internet access)... Pulling so-tcpreplay image ========================================================================= Starting tcpreplay... This could take a while if another Salt job is running. Run this command with --force to stop all Salt jobs before proceeding. ========================================================================= local: ---------- ID: so-tcpreplay Function: docker_container.running -
When the
so-testprocess is complete, the output ends with:Statistics for network device: bond0 Successful packets: 55748 Failed packets: 0 Truncated packets: 0 Retried packets (ENOBUFS): 0 Retried packets (EAGAIN): 0 Replay completed. Warnings shown above are typically expected. [onion@onion2026 ~]$ - Reload the Alert page in Security Onion. The simulated Alert events generated by
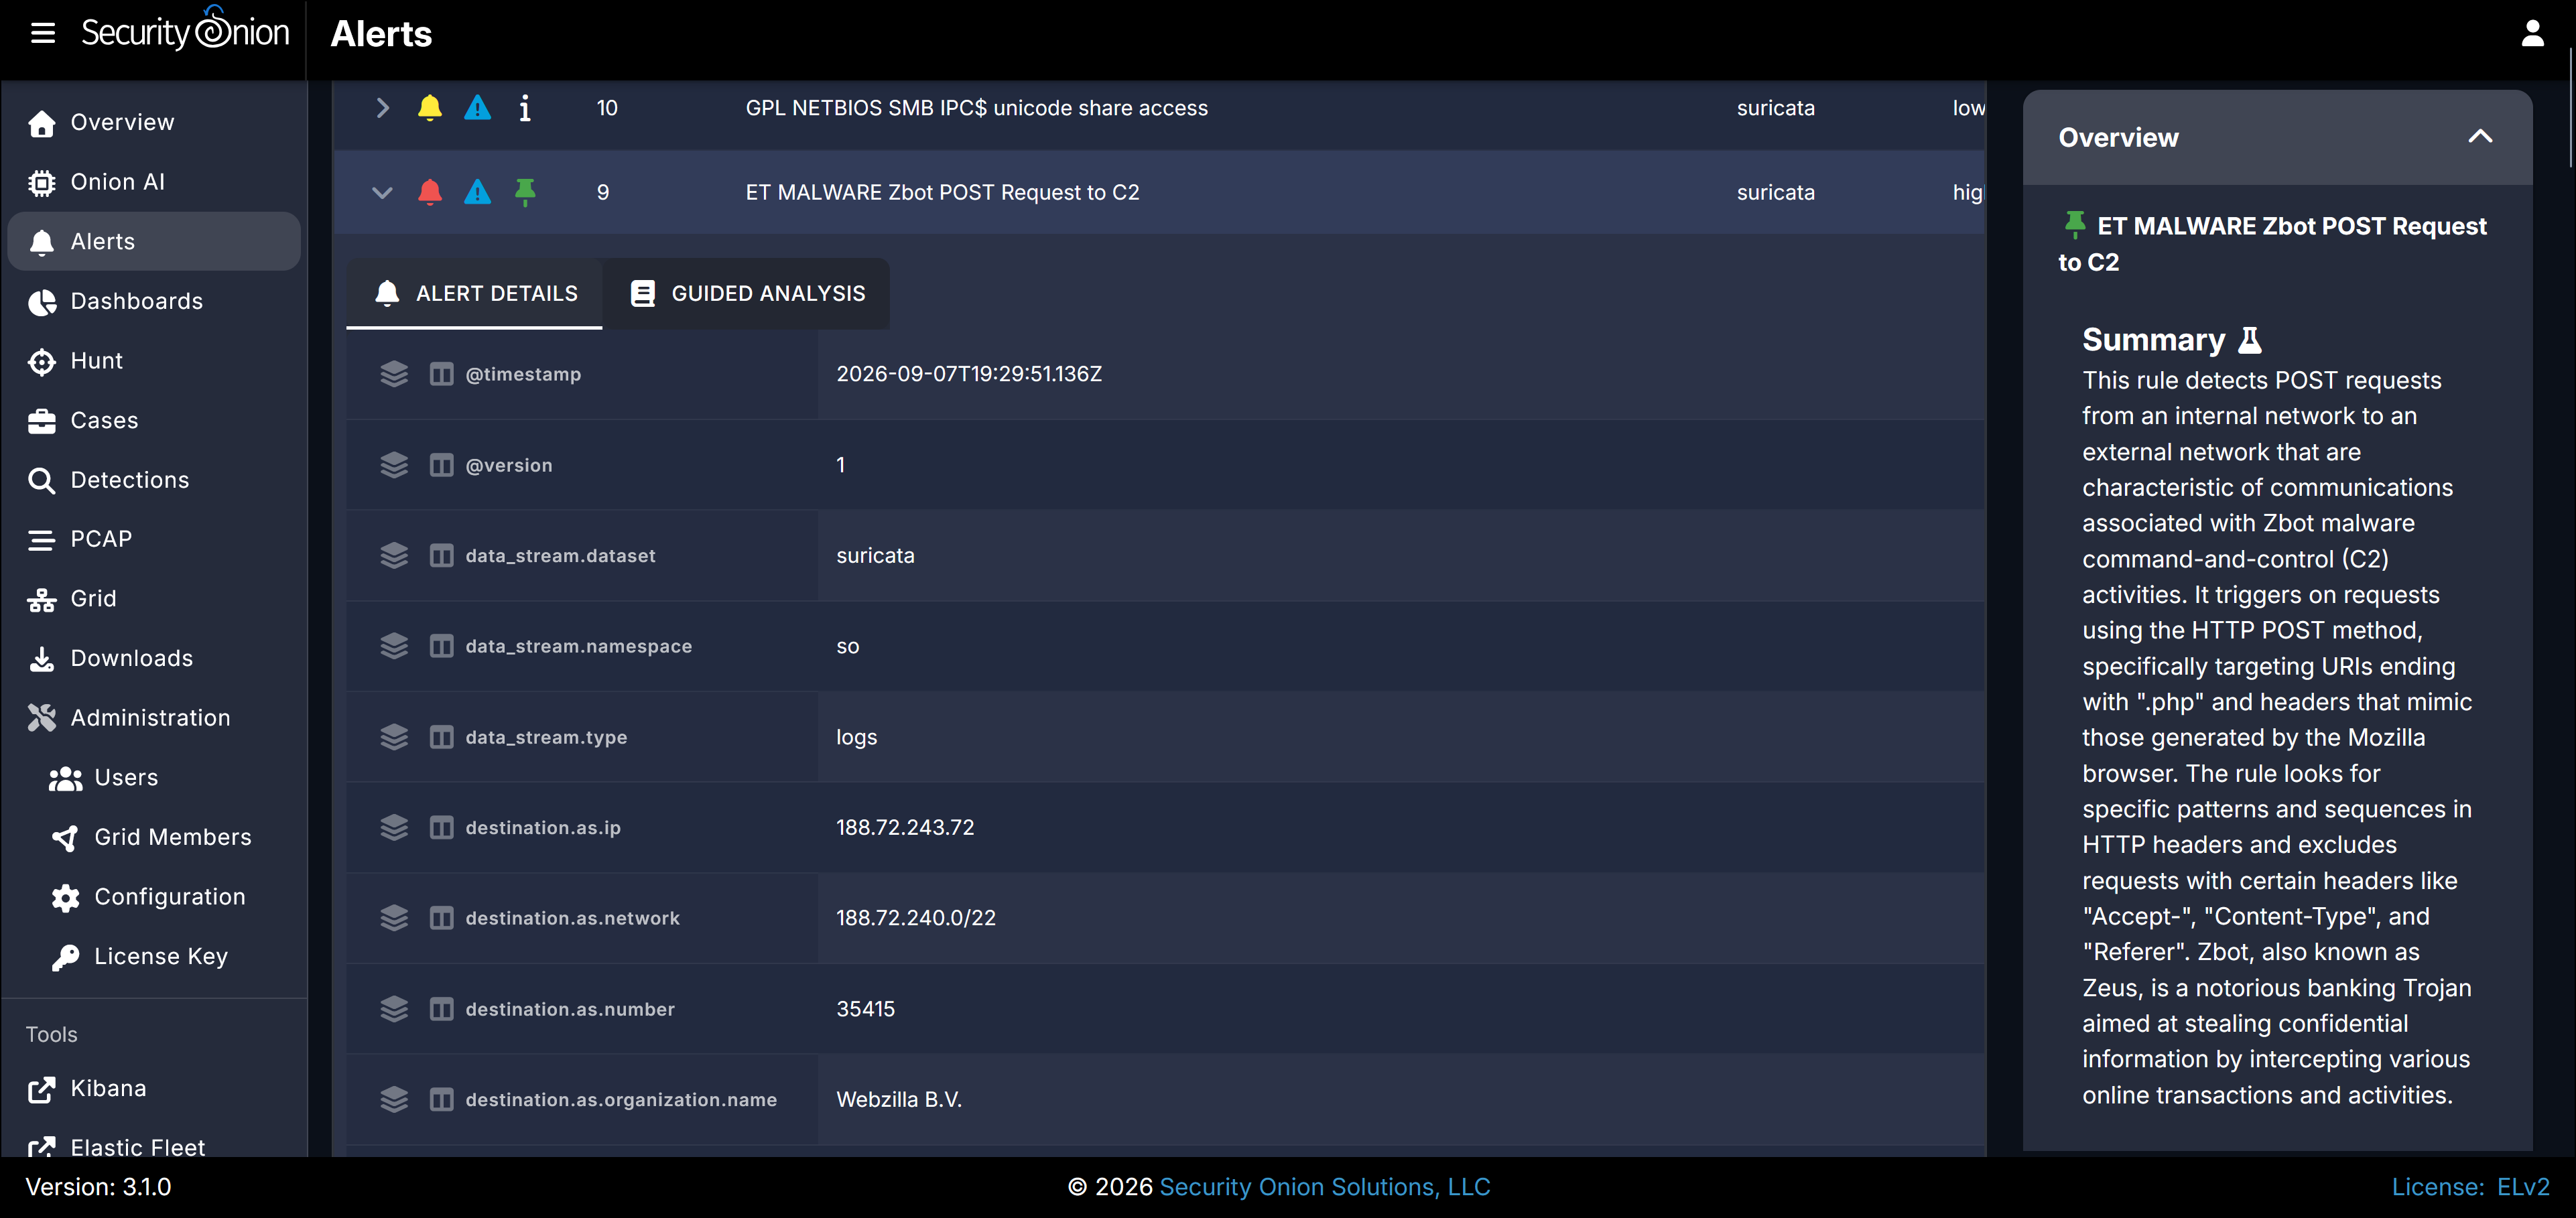
so-testdisplay. Select an event to look at and click its right-facing arrow (>) to twirl it down.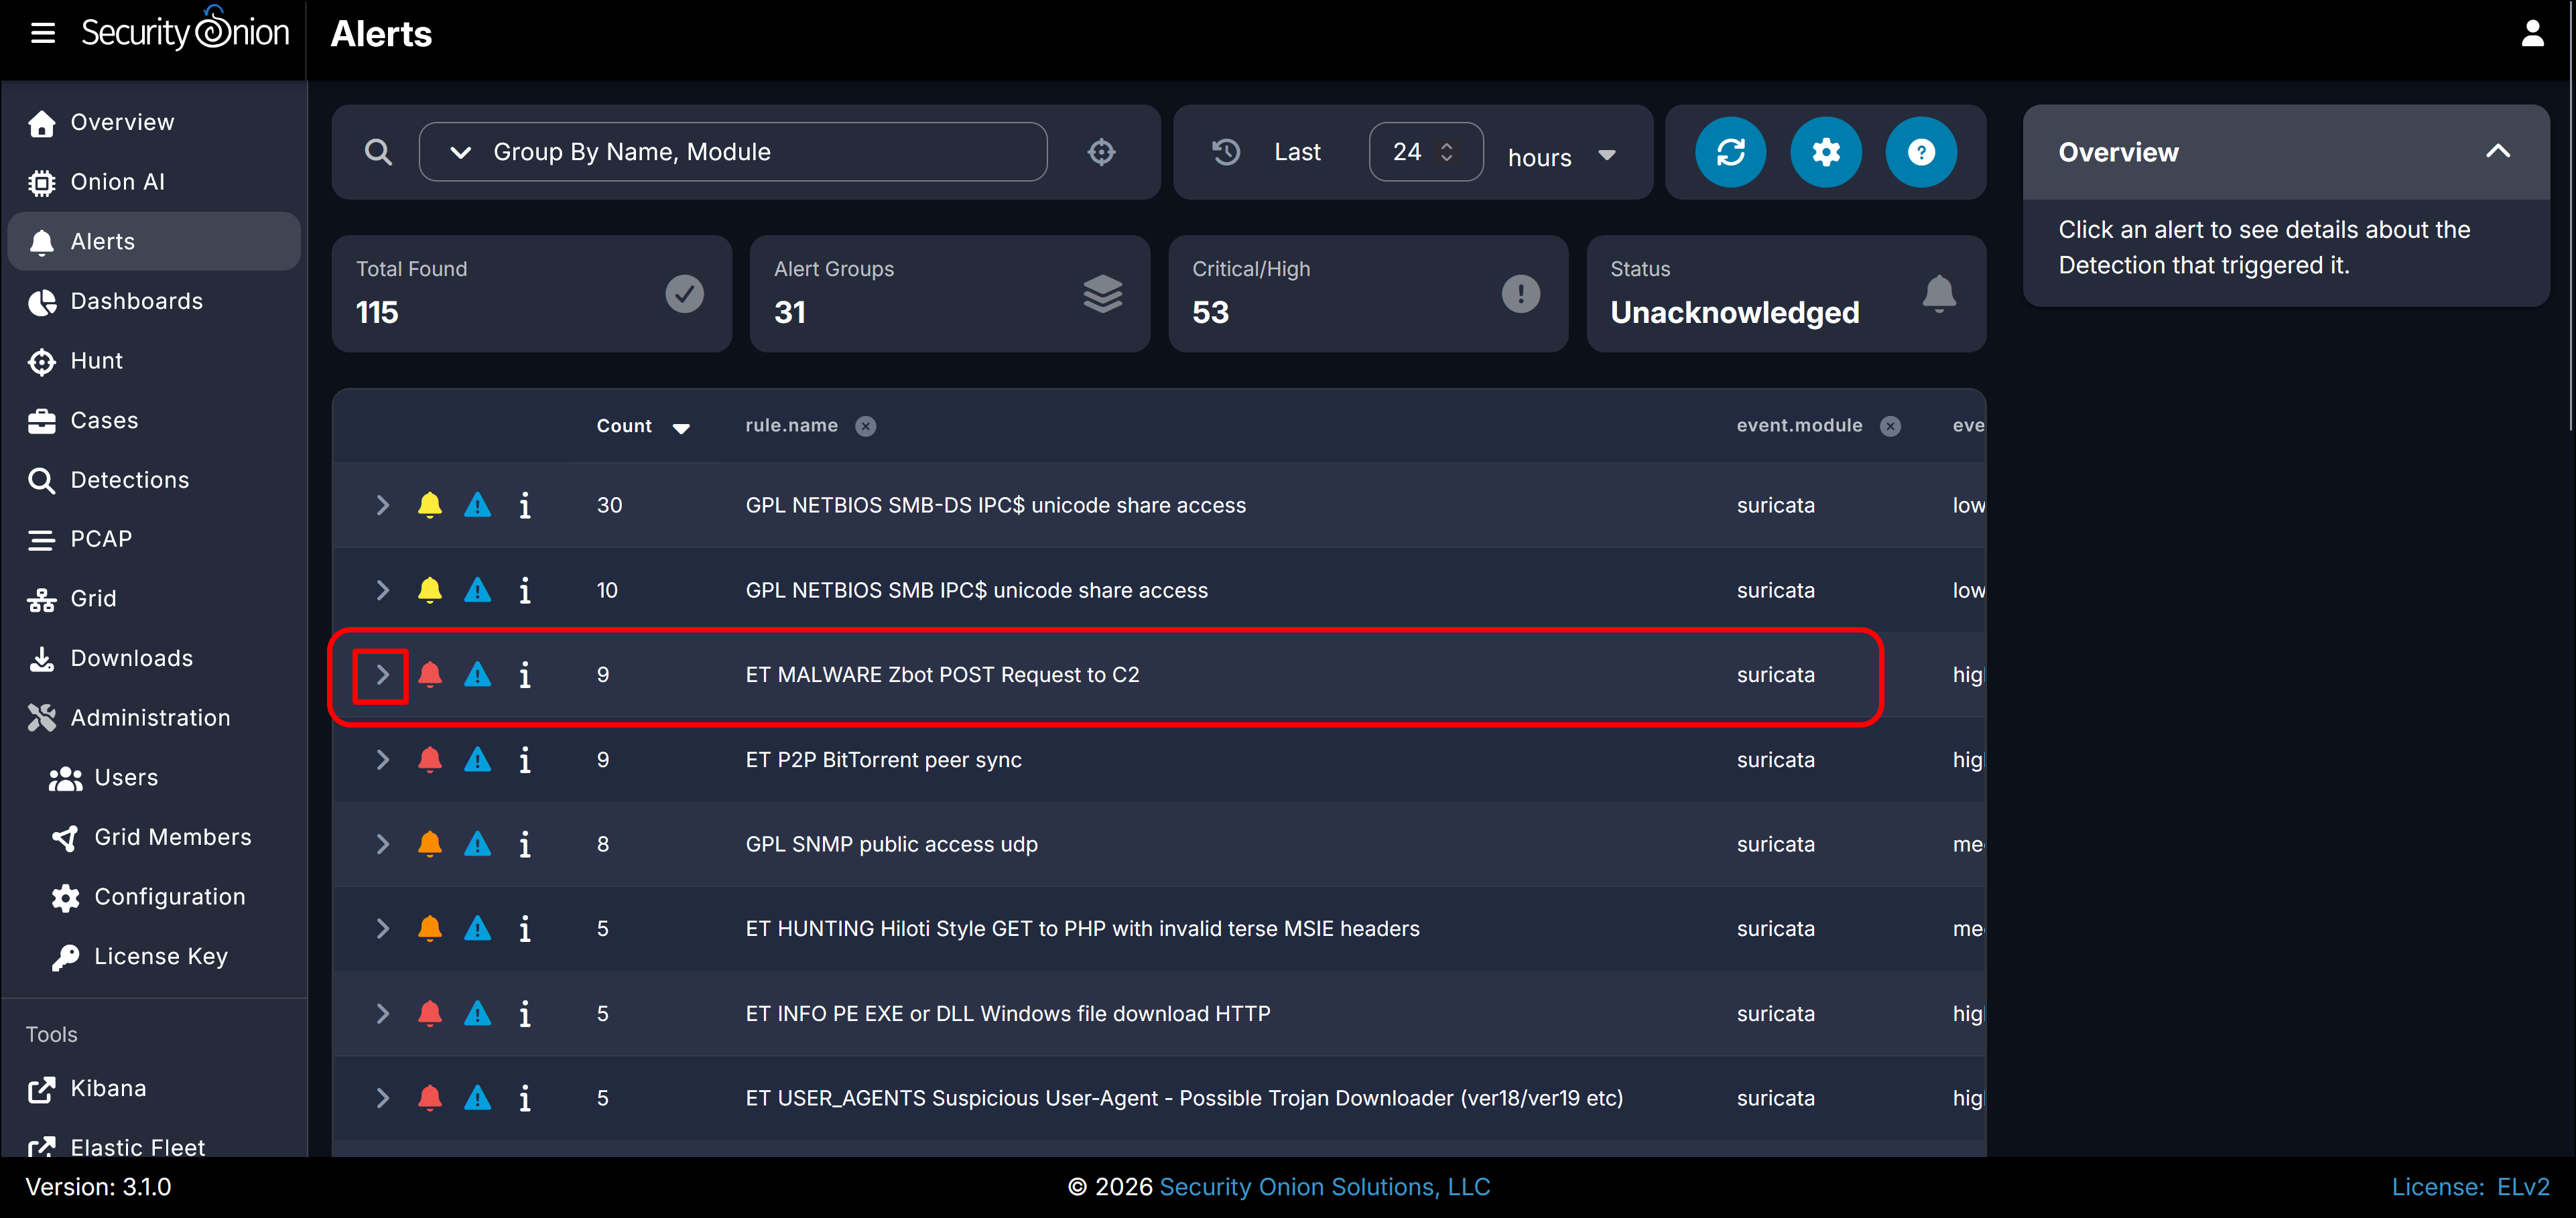
- When you open an alert, there are two tabs. The first is the Alert Details, which provides you with all of the metadata about the alert. This is basically presenting the JSON data you would see in a Kibana search in a format that is more readable to the casual user. There is also an Overview in the right sidebar that provides a Summary of the action detected.
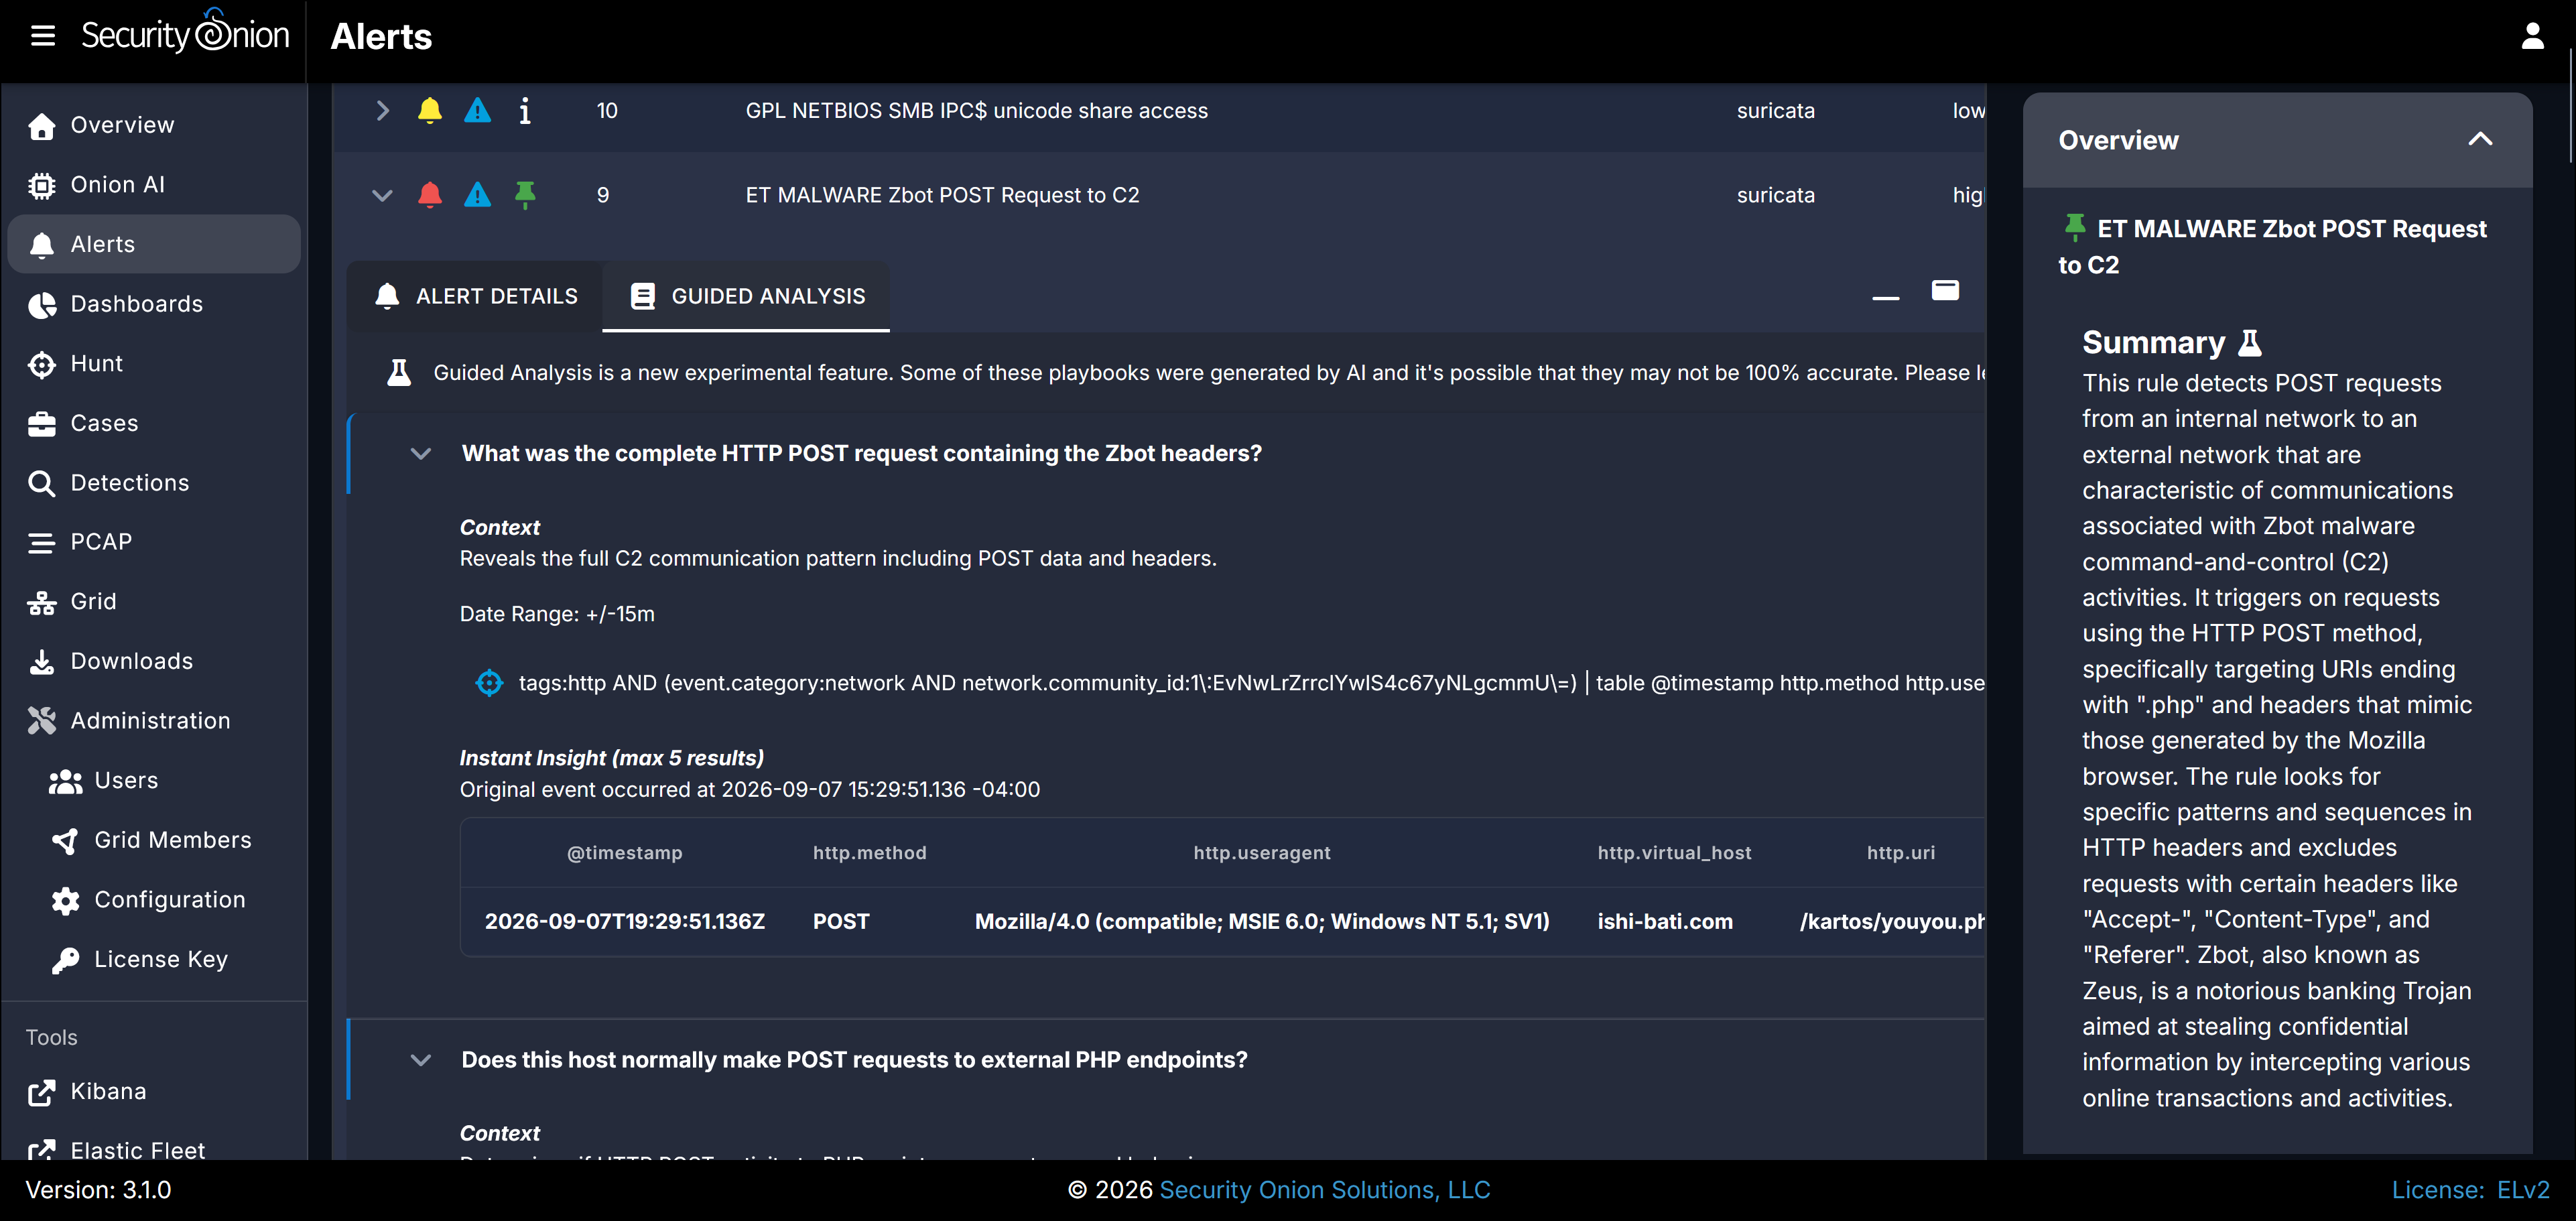
- You can also click on the Guided Analysis tab to see some AI-generated summaries that answer some basic questions about potentially malicious activity.
- If you click Dashboards in the left sidebar, you will see that the default dashboard visualizations are now populated with event data from
so-test.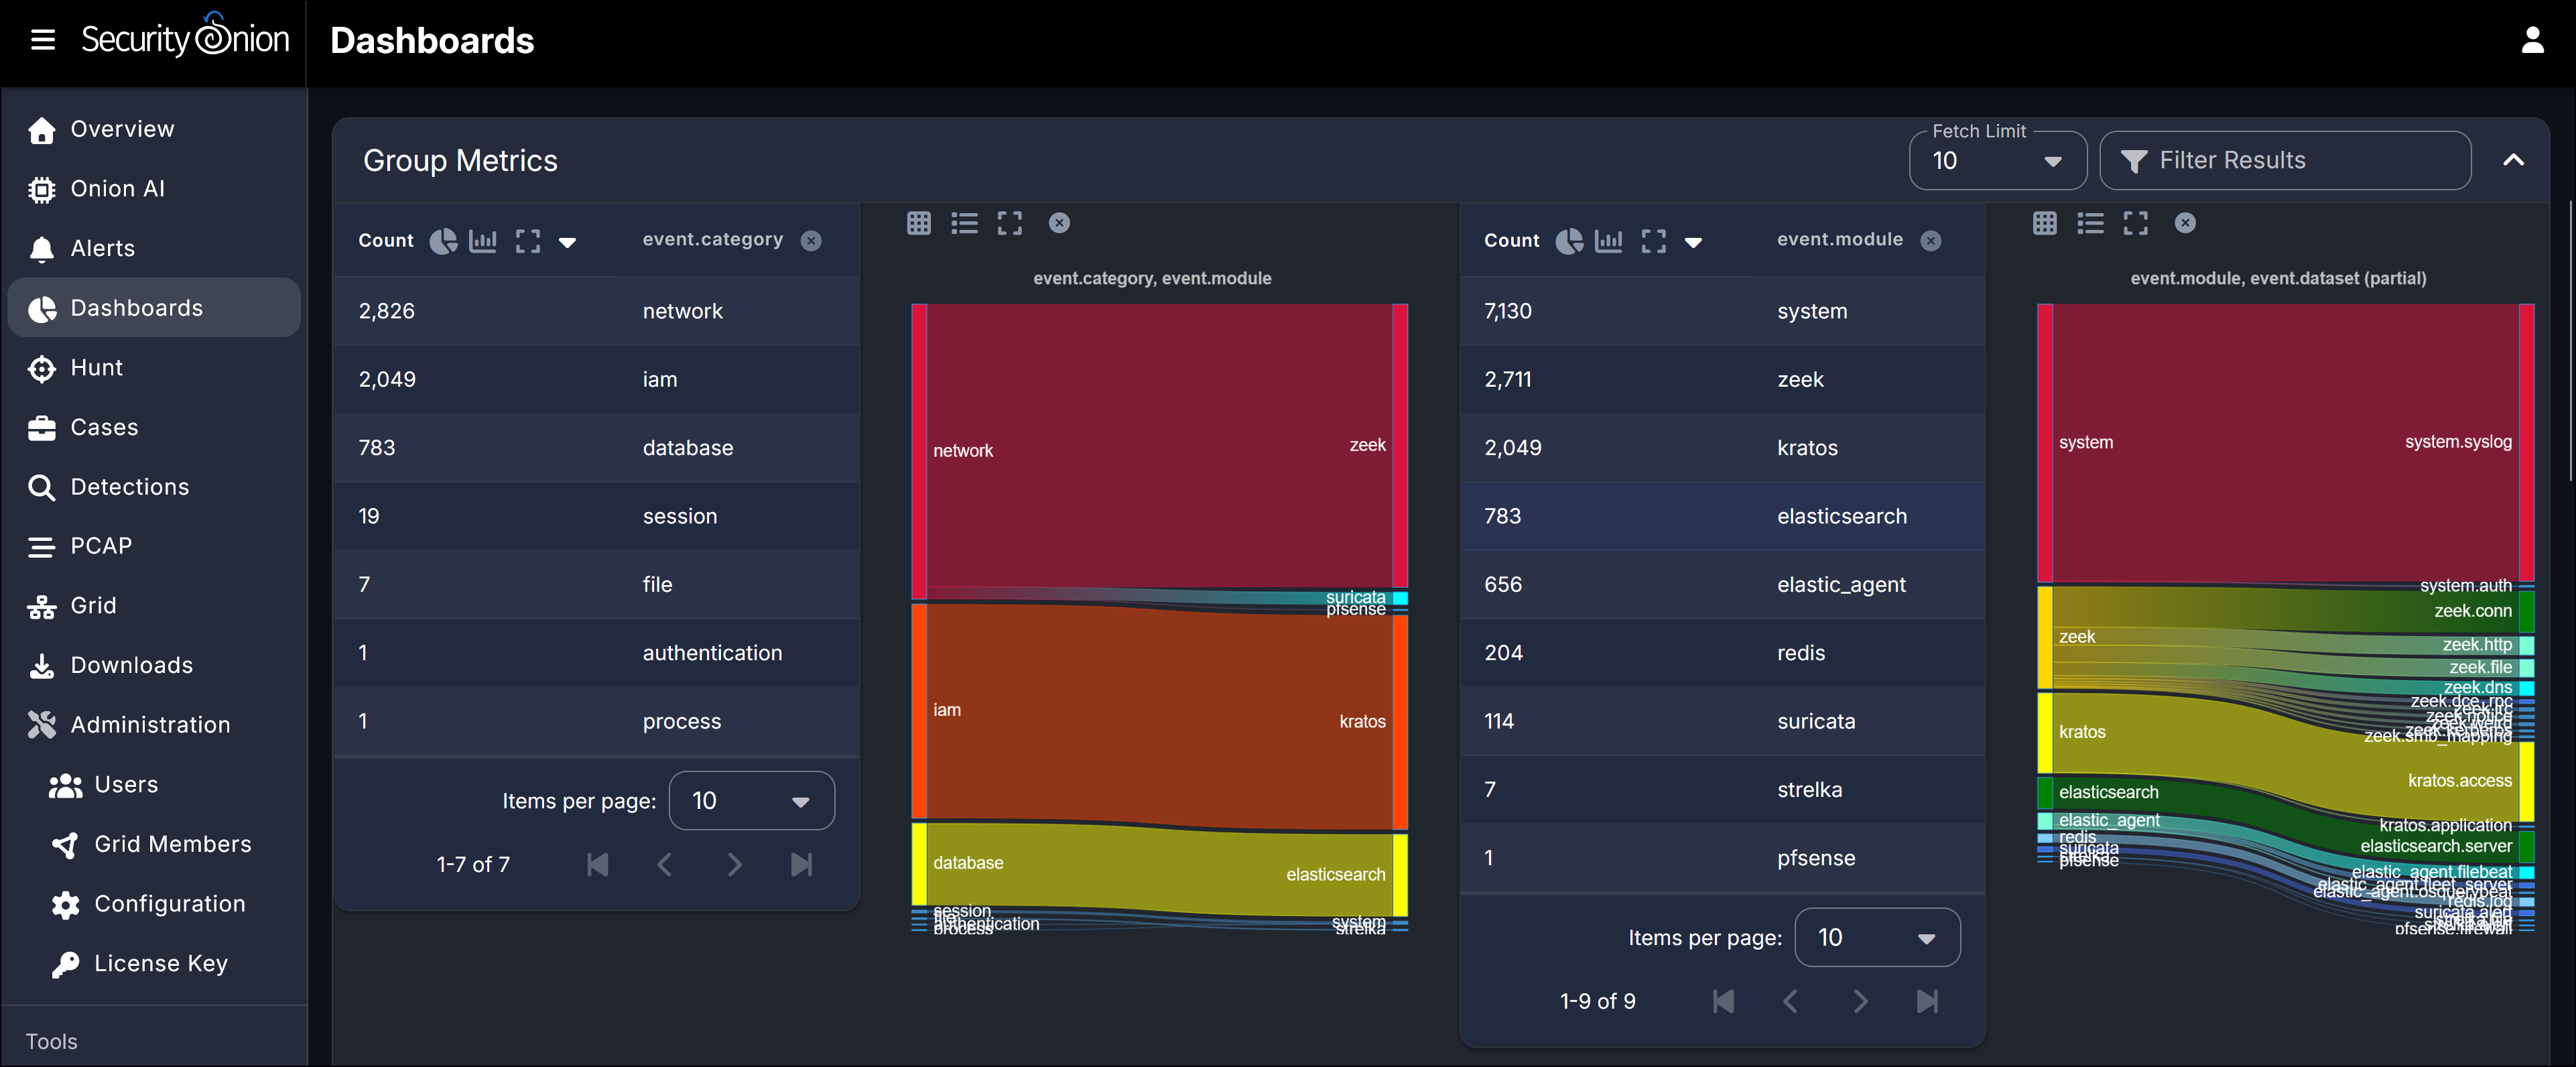
- You can also see the same event data in Kibana. Click Kibana in the left sidebar.
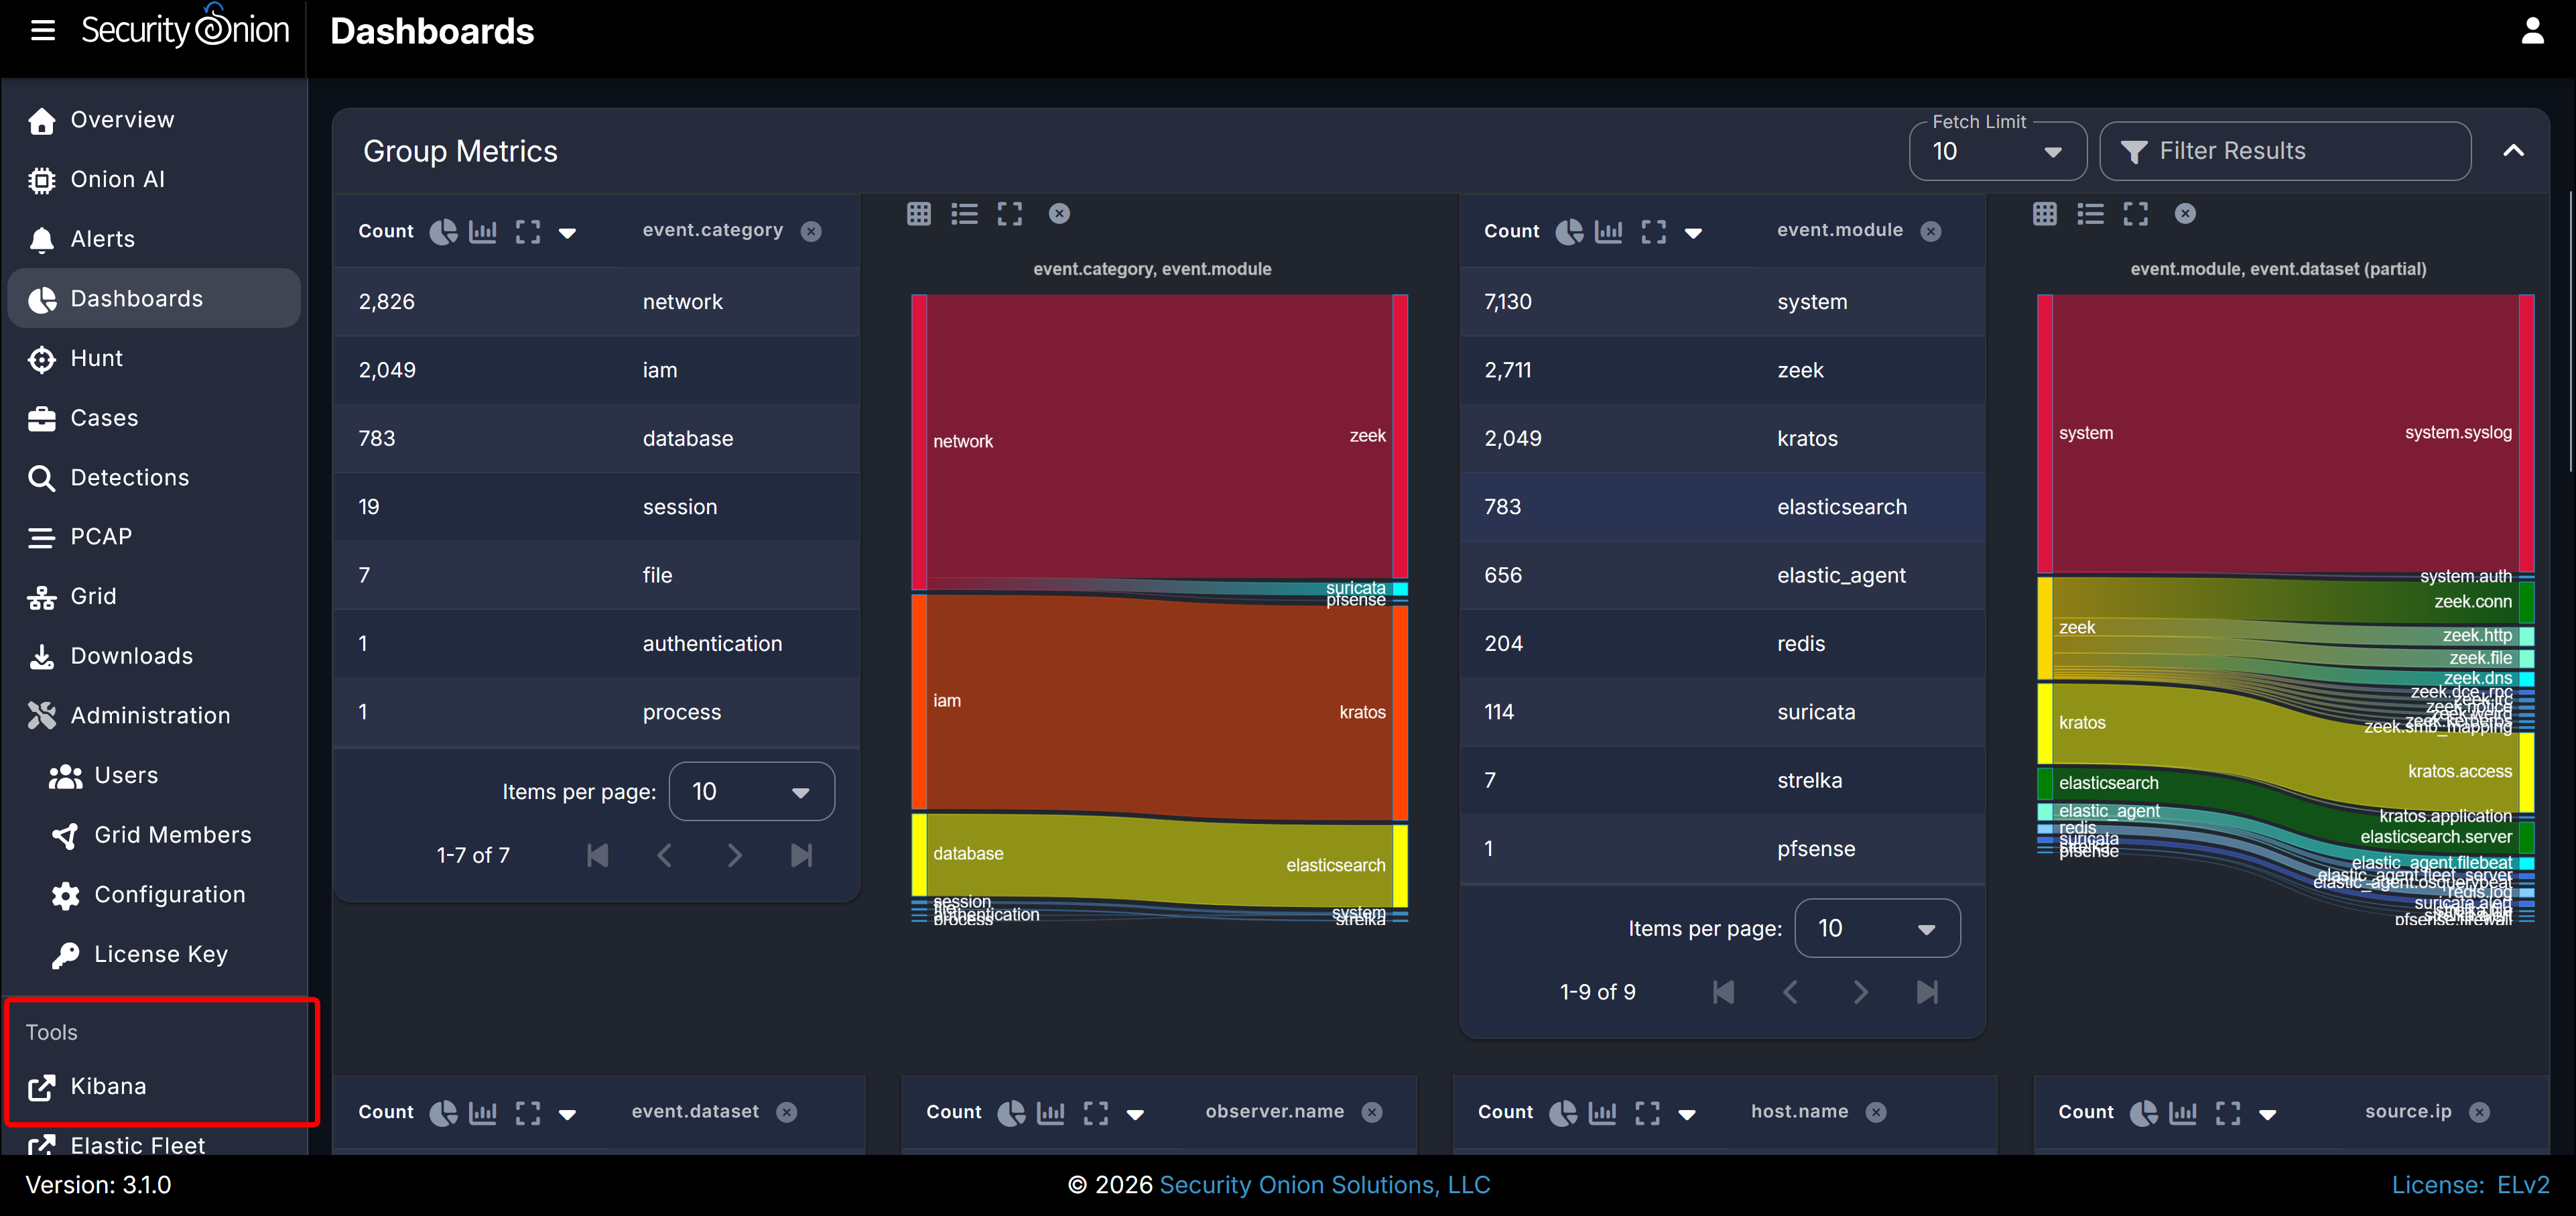
- Your browser will open a new tab or window with an Elastic login screen. Enter the same credentials you used to log in to the Security Onion Console and click Log in.

- Click Alert under Event Category in the Navigation widget on the Kibana home page, which you will notice is now populated with some of the events generated by
so-test.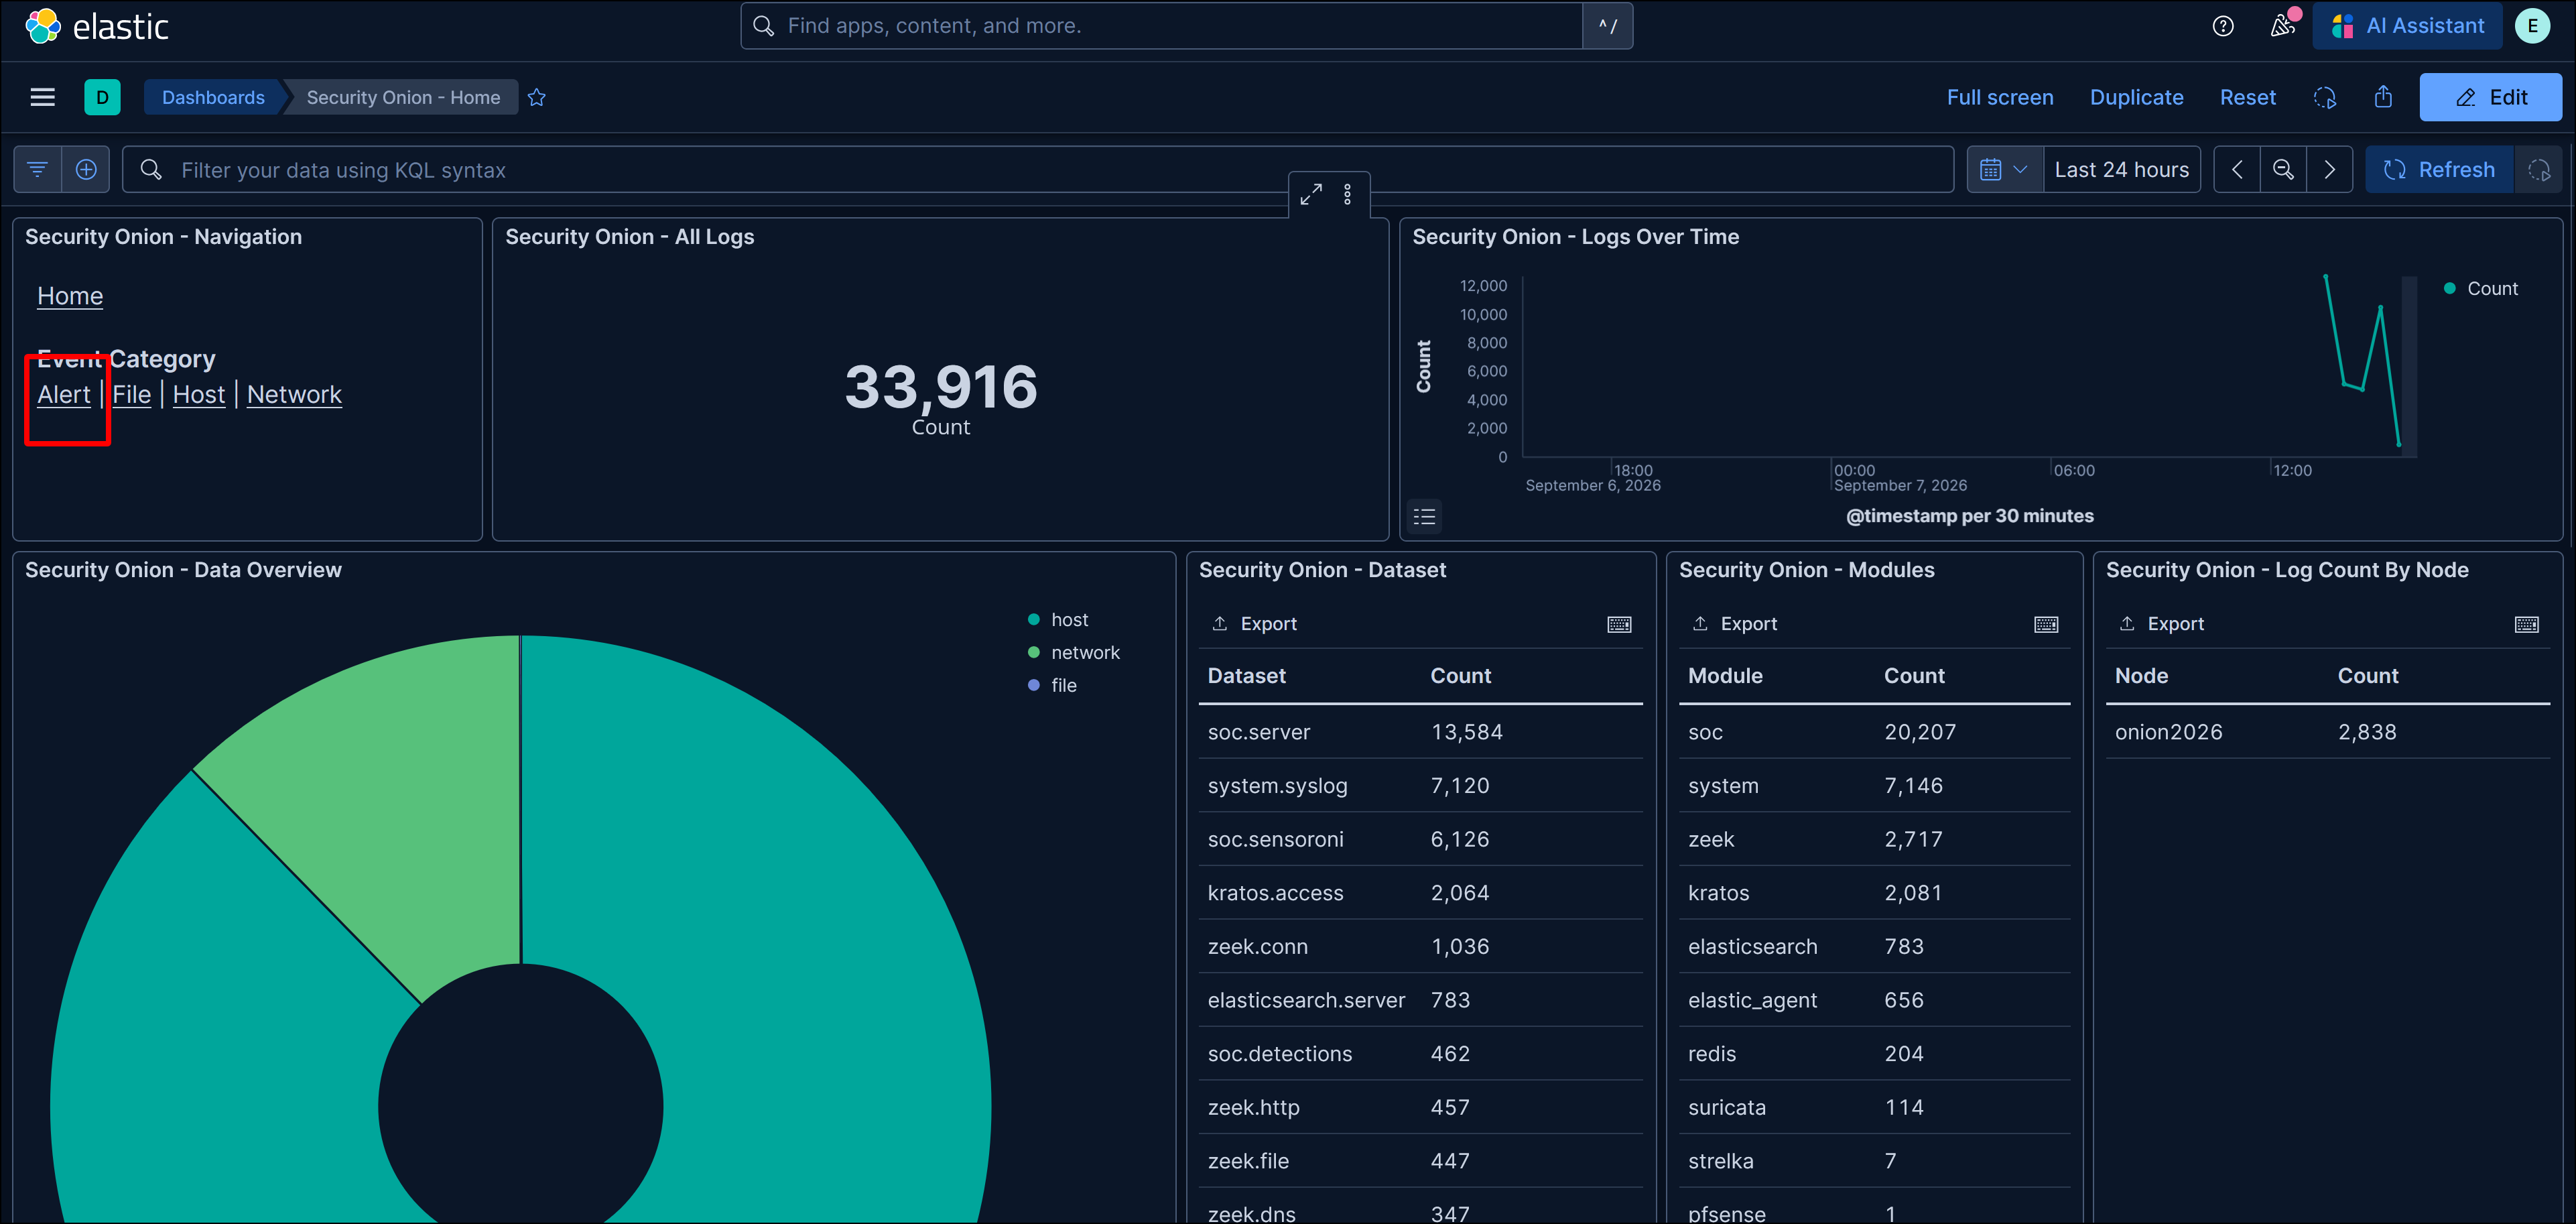
- You can see the same events from the Alerts page on the Security Onion - Alerts page in Kibana.
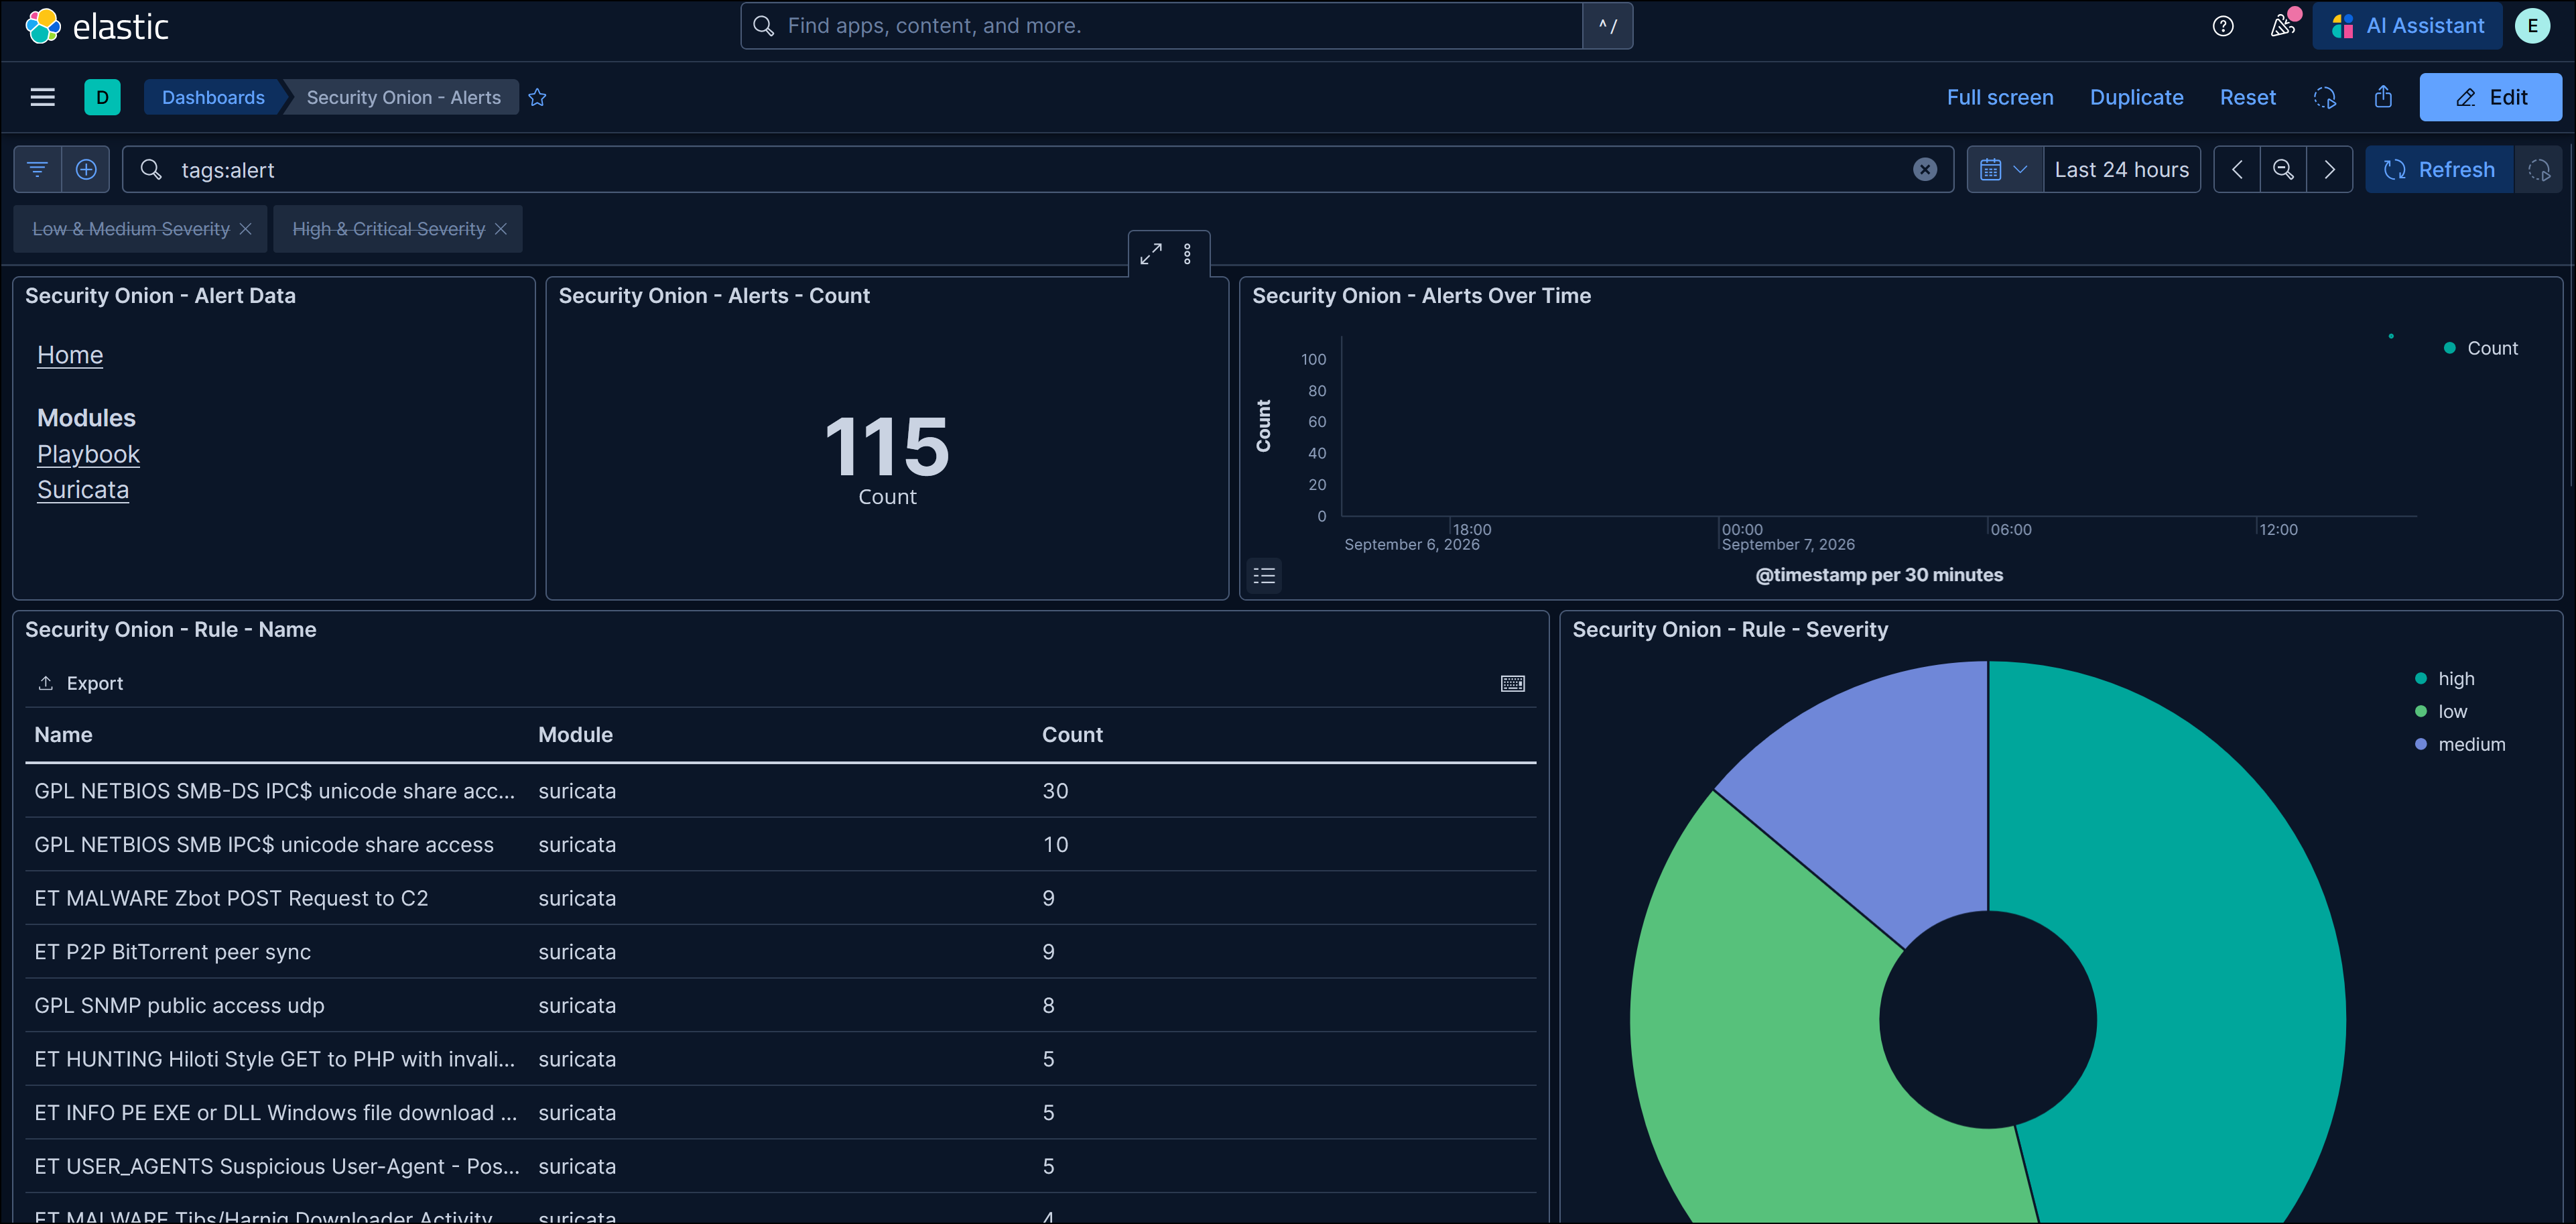
If all of this works, you have demonstrated that your Security Onion deployment can detect network activity, analyze it, identify potenitally malicious activity, and feed that data into the various analytical tools that make up Security Onion. You can now start creating events yourself with your other virtual machines.
Updating Security Onion
Security Onion is actively developed and maintained and makes updates available to users frequently. The update process, called soup for Security Onion UPdater, is executed from the command line.
- Access the command line through the VMware console or over SSH.
- Type
sudo soupand pressEnter. You can alsosudo soup -yfor the update to proceed unattended, where it answers yes to any prompt. - You will see a lot of output as
soupperforms a series of pre-update checks, then downloads packages and container images and installs and starts them. An update can take 20 minutes or longer depending on which version you currently have and what Security Onion is updating.
Clear Security Onion Event Data
Since you ran test data, you may want to reset or clear the event data in Security Onion for when you start simulating your own attacks on the network. You can reset the logs and logging configurations of your Security Onion instance by running these two commands:
sudo so-nsm-clear -h
sudo so-elastic-clear -h
After completing your introduction to Security Onion, completing configuration, and running soup, consider taking a snapshot of your virtual machine.